
There are a few key trends to look for if we want to identify the next multi-bagger. Ideally, a business will show two trends; firstly a growing return on capital employed (ROCE) and secondly, an increasing amount of capital employed. Ultimately, this demonstrates that it's a business that is reinvesting profits at increasing rates of return. However, after briefly looking over the numbers, we don't think Shanghai Tongji Science&Technology IndustrialLtd (SHSE:600846) has the makings of a multi-bagger going forward, but let's have a look at why that may be.
What Is Return On Capital Employed (ROCE)?
For those that aren't sure what ROCE is, it measures the amount of pre-tax profits a company can generate from the capital employed in its business. To calculate this metric for Shanghai Tongji Science&Technology IndustrialLtd, this is the formula:
Return on Capital Employed = Earnings Before Interest and Tax (EBIT) ÷ (Total Assets - Current Liabilities)
0.073 = CN¥285m ÷ (CN¥8.8b - CN¥4.9b) (Based on the trailing twelve months to September 2023).
So, Shanghai Tongji Science&Technology IndustrialLtd has an ROCE of 7.3%. Even though it's in line with the industry average of 6.8%, it's still a low return by itself.
Check out our latest analysis for Shanghai Tongji Science&Technology IndustrialLtd
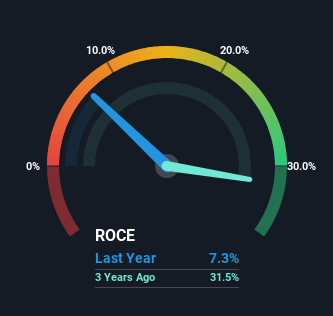
Historical performance is a great place to start when researching a stock so above you can see the gauge for Shanghai Tongji Science&Technology IndustrialLtd's ROCE against it's prior returns. If you're interested in investigating Shanghai Tongji Science&Technology IndustrialLtd's past further, check out this free graph of past earnings, revenue and cash flow.
How Are Returns Trending?
Over the past five years, Shanghai Tongji Science&Technology IndustrialLtd's ROCE has remained relatively flat while the business is using 22% less capital than before. This indicates to us that assets are being sold and thus the business is likely shrinking, which you'll remember isn't the typical ingredients for an up-and-coming multi-bagger. Not only that, but the low returns on this capital mentioned earlier would leave most investors unimpressed.
On a separate but related note, it's important to know that Shanghai Tongji Science&Technology IndustrialLtd has a current liabilities to total assets ratio of 55%, which we'd consider pretty high. This effectively means that suppliers (or short-term creditors) are funding a large portion of the business, so just be aware that this can introduce some elements of risk. While it's not necessarily a bad thing, it can be beneficial if this ratio is lower.
The Key Takeaway
It's a shame to see that Shanghai Tongji Science&Technology IndustrialLtd is effectively shrinking in terms of its capital base. Since the stock has gained an impressive 54% over the last five years, investors must think there's better things to come. However, unless these underlying trends turn more positive, we wouldn't get our hopes up too high.
One more thing: We've identified 3 warning signs with Shanghai Tongji Science&Technology IndustrialLtd (at least 1 which is concerning) , and understanding these would certainly be useful.
If you want to search for solid companies with great earnings, check out this free list of companies with good balance sheets and impressive returns on equity.
Have feedback on this article? Concerned about the content? Get in touch with us directly. Alternatively, email editorial-team (at) simplywallst.com.
This article by Simply Wall St is general in nature. We provide commentary based on historical data and analyst forecasts only using an unbiased methodology and our articles are not intended to be financial advice. It does not constitute a recommendation to buy or sell any stock, and does not take account of your objectives, or your financial situation. We aim to bring you long-term focused analysis driven by fundamental data. Note that our analysis may not factor in the latest price-sensitive company announcements or qualitative material. Simply Wall St has no position in any stocks mentioned.