
China Merchants Property Operation & Service Co., Ltd. (SZSE:001914) shareholders might be concerned after seeing the share price drop 14% in the last quarter. Looking further back, the stock has generated good profits over five years. Its return of 44% has certainly bested the market return!
Although China Merchants Property Operation & Service has shed CN¥2.3b from its market cap this week, let's take a look at its longer term fundamental trends and see if they've driven returns.
See our latest analysis for China Merchants Property Operation & Service
While markets are a powerful pricing mechanism, share prices reflect investor sentiment, not just underlying business performance. One flawed but reasonable way to assess how sentiment around a company has changed is to compare the earnings per share (EPS) with the share price.
During five years of share price growth, China Merchants Property Operation & Service achieved compound earnings per share (EPS) growth of 84% per year. This EPS growth is higher than the 8% average annual increase in the share price. So one could conclude that the broader market has become more cautious towards the stock.
The graphic below depicts how EPS has changed over time (unveil the exact values by clicking on the image).
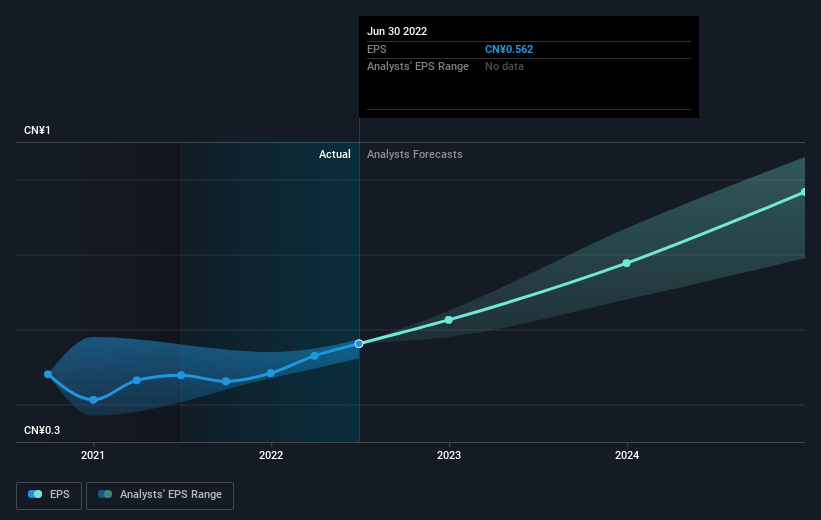 SZSE:001914 Earnings Per Share Growth October 4th 2022
We know that China Merchants Property Operation & Service has improved its bottom line lately, but is it going to grow revenue? Check if analysts think China Merchants Property Operation & Service will grow revenue in the future.
What About Dividends?
When looking at investment returns, it is important to consider the difference between total shareholder return (TSR) and share price return. The TSR incorporates the value of any spin-offs or discounted capital raisings, along with any dividends, based on the assumption that the dividends are reinvested. So for companies that pay a generous dividend, the TSR is often a lot higher than the share price return. As it happens, China Merchants Property Operation & Service's TSR for the last 5 years was 53%, which exceeds the share price return mentioned earlier. And there's no prize for guessing that the dividend payments largely explain the divergence!
A Different Perspective
While it's never nice to take a loss, China Merchants Property Operation & Service shareholders can take comfort that , including dividends,their trailing twelve month loss of 1.5% wasn't as bad as the market loss of around 18%. Longer term investors wouldn't be so upset, since they would have made 9%, each year, over five years. In the best case scenario the last year is just a temporary blip on the journey to a brighter future. While it is well worth considering the different impacts that market conditions can have on the share price, there are other factors that are even more important. For example, we've discovered 1 warning sign for China Merchants Property Operation & Service that you should be aware of before investing here.
If you like to buy stocks alongside management, then you might just love this free list of companies. (Hint: insiders have been buying them).
Please note, the market returns quoted in this article reflect the market weighted average returns of stocks that currently trade on CN exchanges.
Have feedback on this article? Concerned about the content? Get in touch with us directly. Alternatively, email editorial-team (at) simplywallst.com.
This article by Simply Wall St is general in nature. We provide commentary based on historical data and analyst forecasts only using an unbiased methodology and our articles are not intended to be financial advice. It does not constitute a recommendation to buy or sell any stock, and does not take account of your objectives, or your financial situation. We aim to bring you long-term focused analysis driven by fundamental data. Note that our analysis may not factor in the latest price-sensitive company announcements or qualitative material. Simply Wall St has no position in any stocks mentioned.