
These days it's easy to simply buy an index fund, and your returns should (roughly) match the market. But investors can boost returns by picking market-beating companies to own shares in. For example, the Sembcorp Industries Ltd (SGX:U96) share price is up 67% in the last 1 year, clearly besting the market decline of around 1.0% (not including dividends). If it can keep that out-performance up over the long term, investors will do very well! And shareholders have also done well over the long term, with an increase of 45% in the last three years.
Now it's worth having a look at the company's fundamentals too, because that will help us determine if the long term shareholder return has matched the performance of the underlying business.
Check out our latest analysis for Sembcorp Industries
To quote Buffett, 'Ships will sail around the world but the Flat Earth Society will flourish. There will continue to be wide discrepancies between price and value in the marketplace...' One flawed but reasonable way to assess how sentiment around a company has changed is to compare the earnings per share (EPS) with the share price.
During the last year Sembcorp Industries grew its earnings per share (EPS) by 190%. This EPS growth is significantly higher than the 67% increase in the share price. So it seems like the market has cooled on Sembcorp Industries, despite the growth. Interesting. The caution is also evident in the lowish P/E ratio of 7.74.
The company's earnings per share (over time) is depicted in the image below (click to see the exact numbers).
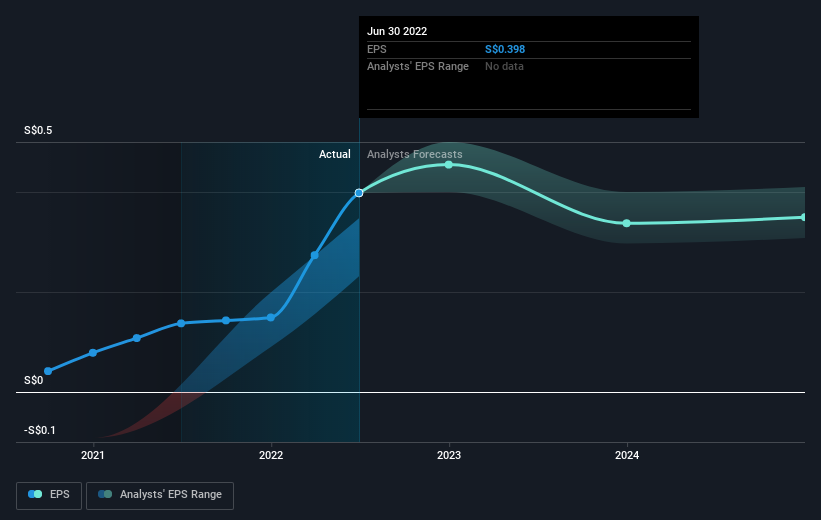 SGX:U96 Earnings Per Share Growth September 28th 2022
We know that Sembcorp Industries has improved its bottom line lately, but is it going to grow revenue? This free report showing analyst revenue forecasts should help you figure out if the EPS growth can be sustained.
What About Dividends?
When looking at investment returns, it is important to consider the difference between total shareholder return (TSR) and share price return. Whereas the share price return only reflects the change in the share price, the TSR includes the value of dividends (assuming they were reinvested) and the benefit of any discounted capital raising or spin-off. Arguably, the TSR gives a more comprehensive picture of the return generated by a stock. As it happens, Sembcorp Industries' TSR for the last 1 year was 71%, which exceeds the share price return mentioned earlier. And there's no prize for guessing that the dividend payments largely explain the divergence!
A Different Perspective
We're pleased to report that Sembcorp Industries shareholders have received a total shareholder return of 71% over one year. And that does include the dividend. That's better than the annualised return of 18% over half a decade, implying that the company is doing better recently. Given the share price momentum remains strong, it might be worth taking a closer look at the stock, lest you miss an opportunity. It's always interesting to track share price performance over the longer term. But to understand Sembcorp Industries better, we need to consider many other factors. Take risks, for example - Sembcorp Industries has 3 warning signs (and 2 which can't be ignored) we think you should know about.
If you like to buy stocks alongside management, then you might just love this free list of companies. (Hint: insiders have been buying them).
Please note, the market returns quoted in this article reflect the market weighted average returns of stocks that currently trade on SG exchanges.
Have feedback on this article? Concerned about the content? Get in touch with us directly. Alternatively, email editorial-team (at) simplywallst.com.
This article by Simply Wall St is general in nature. We provide commentary based on historical data and analyst forecasts only using an unbiased methodology and our articles are not intended to be financial advice. It does not constitute a recommendation to buy or sell any stock, and does not take account of your objectives, or your financial situation. We aim to bring you long-term focused analysis driven by fundamental data. Note that our analysis may not factor in the latest price-sensitive company announcements or qualitative material. Simply Wall St has no position in any stocks mentioned.