
Zhejiang Windey Co.,Ltd. (SZSE:300772) shareholders might be concerned after seeing the share price drop 16% in the last month. But that doesn't change the fact that the returns over the last three years have been very strong. In three years the stock price has launched 113% higher: a great result. To some, the recent share price pullback wouldn't be surprising after such a good run. If the business can perform well for years to come, then the recent drop could be an opportunity.
Although Zhejiang WindeyLtd has shed CN¥1.3b from its market cap this week, let's take a look at its longer term fundamental trends and see if they've driven returns.
See our latest analysis for Zhejiang WindeyLtd
While the efficient markets hypothesis continues to be taught by some, it has been proven that markets are over-reactive dynamic systems, and investors are not always rational. By comparing earnings per share (EPS) and share price changes over time, we can get a feel for how investor attitudes to a company have morphed over time.
Zhejiang WindeyLtd was able to grow its EPS at 46% per year over three years, sending the share price higher. The average annual share price increase of 29% is actually lower than the EPS growth. So it seems investors have become more cautious about the company, over time.
The company's earnings per share (over time) is depicted in the image below (click to see the exact numbers).
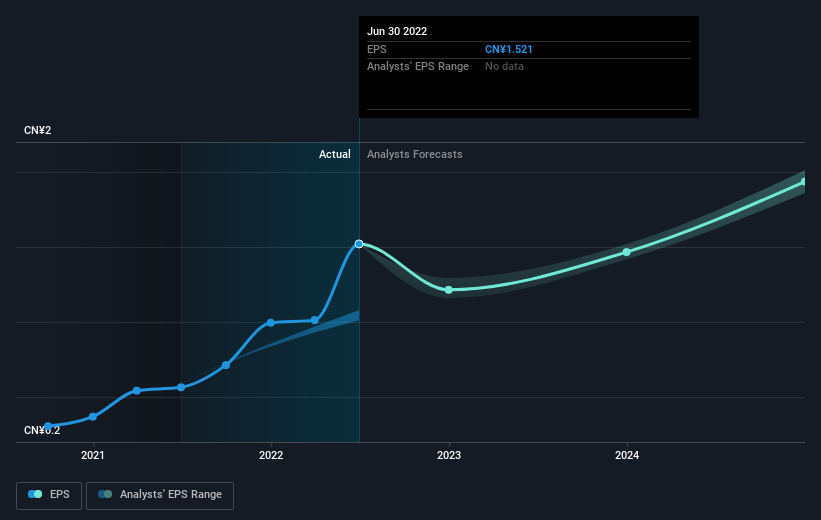 SZSE:300772 Earnings Per Share Growth September 20th 2022
It is of course excellent to see how Zhejiang WindeyLtd has grown profits over the years, but the future is more important for shareholders. You can see how its balance sheet has strengthened (or weakened) over time in this free interactive graphic.
What About Dividends?
As well as measuring the share price return, investors should also consider the total shareholder return (TSR). The TSR incorporates the value of any spin-offs or discounted capital raisings, along with any dividends, based on the assumption that the dividends are reinvested. It's fair to say that the TSR gives a more complete picture for stocks that pay a dividend. As it happens, Zhejiang WindeyLtd's TSR for the last 3 years was 118%, which exceeds the share price return mentioned earlier. This is largely a result of its dividend payments!
A Different Perspective
The last twelve months weren't great for Zhejiang WindeyLtd shares, which performed worse than the market, costing holders 43%, including dividends. Meanwhile, the broader market slid about 16%, likely weighing on the stock. Investors are up over three years, booking 30% per year, much better than the more recent returns. Sometimes when a good quality long term winner has a weak period, it's turns out to be an opportunity, but you really need to be sure that the quality is there. I find it very interesting to look at share price over the long term as a proxy for business performance. But to truly gain insight, we need to consider other information, too. Case in point: We've spotted 2 warning signs for Zhejiang WindeyLtd you should be aware of.
If you are like me, then you will not want to miss this free list of growing companies that insiders are buying.
Please note, the market returns quoted in this article reflect the market weighted average returns of stocks that currently trade on CN exchanges.
Have feedback on this article? Concerned about the content? Get in touch with us directly. Alternatively, email editorial-team (at) simplywallst.com.
This article by Simply Wall St is general in nature. We provide commentary based on historical data and analyst forecasts only using an unbiased methodology and our articles are not intended to be financial advice. It does not constitute a recommendation to buy or sell any stock, and does not take account of your objectives, or your financial situation. We aim to bring you long-term focused analysis driven by fundamental data. Note that our analysis may not factor in the latest price-sensitive company announcements or qualitative material. Simply Wall St has no position in any stocks mentioned.