
A look at the shareholders of EC Healthcare (HKG:2138) can tell us which group is most powerful. With 62% stake, individual insiders possess the maximum shares in the company. That is, the group stands to benefit the most if the stock rises (or lose the most if there is a downturn).
It's interesting to note that insiders have been buying shares recently. Their expectations, however, were not satisfied, as the market cap dropped to HK$6.0b over the past week.
Let's take a closer look to see what the different types of shareholders can tell us about EC Healthcare.
 View our latest analysis for EC Healthcare
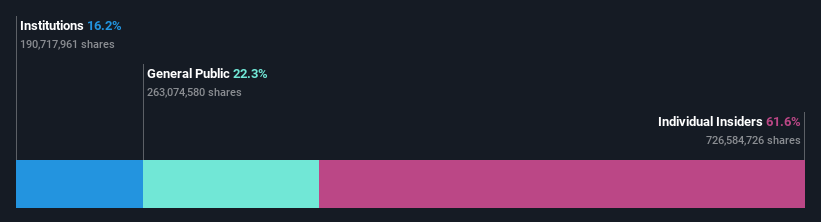 SEHK:2138 Ownership Breakdown September 20th 2022
What Does The Institutional Ownership Tell Us About EC Healthcare?
Many institutions measure their performance against an index that approximates the local market. So they usually pay more attention to companies that are included in major indices.
We can see that EC Healthcare does have institutional investors; and they hold a good portion of the company's stock. This implies the analysts working for those institutions have looked at the stock and they like it. But just like anyone else, they could be wrong. It is not uncommon to see a big share price drop if two large institutional investors try to sell out of a stock at the same time. So it is worth checking the past earnings trajectory of EC Healthcare, (below). Of course, keep in mind that there are other factors to consider, too.
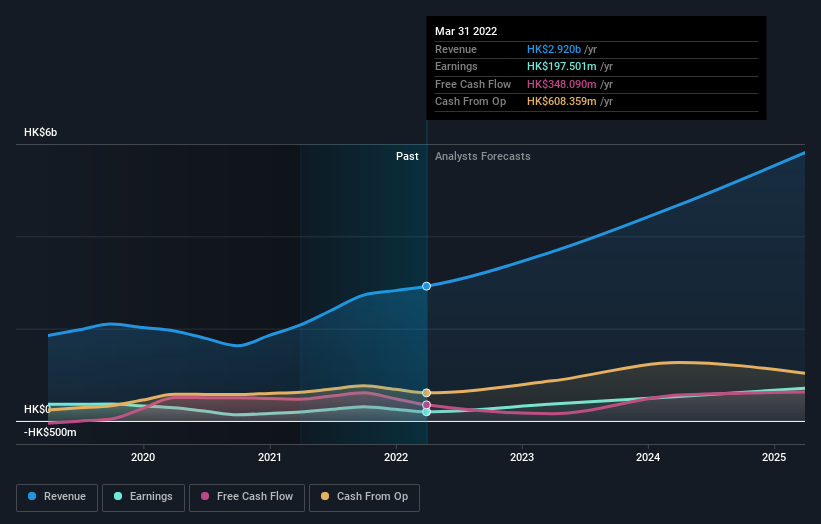 SEHK:2138 Earnings and Revenue Growth September 20th 2022
Hedge funds don't have many shares in EC Healthcare. Looking at our data, we can see that the largest shareholder is the CEO Chi Fai Tang with 61% of shares outstanding. This essentially means that they have significant control over the outcome or future of the company, which is why insider ownership is usually looked upon favourably by prospective buyers. For context, the second largest shareholder holds about 4.3% of the shares outstanding, followed by an ownership of 4.0% by the third-largest shareholder.
While studying institutional ownership for a company can add value to your research, it is also a good practice to research analyst recommendations to get a deeper understand of a stock's expected performance. There are a reasonable number of analysts covering the stock, so it might be useful to find out their aggregate view on the future.
Insider Ownership Of EC Healthcare
The definition of an insider can differ slightly between different countries, but members of the board of directors always count. Company management run the business, but the CEO will answer to the board, even if he or she is a member of it.
I generally consider insider ownership to be a good thing. However, on some occasions it makes it more difficult for other shareholders to hold the board accountable for decisions.
Our information suggests that insiders own more than half of EC Healthcare. This gives them effective control of the company. Given it has a market cap of HK$6.0b, that means they have HK$3.7b worth of shares. Most would argue this is a positive, showing strong alignment with shareholders. You can click here to see if those insiders have been buying or selling.
General Public Ownership
The general public, who are usually individual investors, hold a 22% stake in EC Healthcare. While this size of ownership may not be enough to sway a policy decision in their favour, they can still make a collective impact on company policies.
Next Steps:
While it is well worth considering the different groups that own a company, there are other factors that are even more important.
I like to dive deeper into how a company has performed in the past. You can find historic revenue and earnings in this detailed graph.
If you are like me, you may want to think about whether this company will grow or shrink. Luckily, you can check this free report showing analyst forecasts for its future.
NB: Figures in this article are calculated using data from the last twelve months, which refer to the 12-month period ending on the last date of the month the financial statement is dated. This may not be consistent with full year annual report figures.
Have feedback on this article? Concerned about the content? Get in touch with us directly. Alternatively, email editorial-team (at) simplywallst.com.
This article by Simply Wall St is general in nature. We provide commentary based on historical data and analyst forecasts only using an unbiased methodology and our articles are not intended to be financial advice. It does not constitute a recommendation to buy or sell any stock, and does not take account of your objectives, or your financial situation. We aim to bring you long-term focused analysis driven by fundamental data. Note that our analysis may not factor in the latest price-sensitive company announcements or qualitative material. Simply Wall St has no position in any stocks mentioned.