
What are the early trends we should look for to identify a stock that could multiply in value over the long term? Ideally, a business will show two trends; firstly a growing return on capital employed (ROCE) and secondly, an increasing amount of capital employed. Put simply, these types of businesses are compounding machines, meaning they are continually reinvesting their earnings at ever-higher rates of return. That's why when we briefly looked at Xinyi Energy Holdings' (HKG:3868) ROCE trend, we were pretty happy with what we saw.
Return On Capital Employed (ROCE): What Is It?
Just to clarify if you're unsure, ROCE is a metric for evaluating how much pre-tax income (in percentage terms) a company earns on the capital invested in its business. To calculate this metric for Xinyi Energy Holdings, this is the formula:
Return on Capital Employed = Earnings Before Interest and Tax (EBIT) ÷ (Total Assets - Current Liabilities)
 0.11 = HK$1.7b ÷ (HK$21b - HK$5.6b) (Based on the trailing twelve months to June 2022).
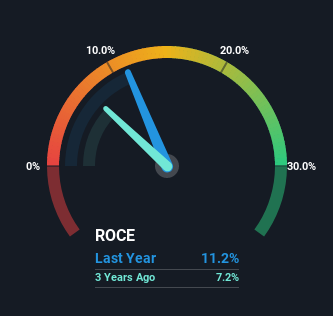
So, Xinyi Energy Holdings has an ROCE of 11%. In absolute terms, that's a satisfactory return, but compared to the Renewable Energy industry average of 6.8% it's much better.
See our latest analysis for Xinyi Energy Holdings
 SEHK:3868 Return on Capital Employed September 19th 2022
Above you can see how the current ROCE for Xinyi Energy Holdings compares to its prior returns on capital, but there's only so much you can tell from the past. If you'd like, you can check out the forecasts from the analysts covering Xinyi Energy Holdings here for free.
The Trend Of ROCE
The trend of ROCE doesn't stand out much, but returns on a whole are decent. The company has consistently earned 11% for the last five years, and the capital employed within the business has risen 107% in that time. 11% is a pretty standard return, and it provides some comfort knowing that Xinyi Energy Holdings has consistently earned this amount. Stable returns in this ballpark can be unexciting, but if they can be maintained over the long run, they often provide nice rewards to shareholders.
Another point to note, we noticed the company has increased current liabilities over the last five years. This is intriguing because if current liabilities hadn't increased to 27% of total assets, this reported ROCE would probably be less than11% because total capital employed would be higher.The 11% ROCE could be even lower if current liabilities weren't 27% of total assets, because the the formula would show a larger base of total capital employed. So while current liabilities isn't high right now, keep an eye out in case it increases further, because this can introduce some elements of risk.
What We Can Learn From Xinyi Energy Holdings' ROCE
In the end, Xinyi Energy Holdings has proven its ability to adequately reinvest capital at good rates of return. And since the stock has risen strongly over the last three years, it appears the market might expect this trend to continue. So while investors seem to be recognizing these promising trends, we still believe the stock deserves further research.
Xinyi Energy Holdings does have some risks, we noticed 2 warning signs (and 1 which is significant) we think you should know about.
While Xinyi Energy Holdings isn't earning the highest return, check out this free list of companies that are earning high returns on equity with solid balance sheets.
Have feedback on this article? Concerned about the content? Get in touch with us directly. Alternatively, email editorial-team (at) simplywallst.com.
This article by Simply Wall St is general in nature. We provide commentary based on historical data and analyst forecasts only using an unbiased methodology and our articles are not intended to be financial advice. It does not constitute a recommendation to buy or sell any stock, and does not take account of your objectives, or your financial situation. We aim to bring you long-term focused analysis driven by fundamental data. Note that our analysis may not factor in the latest price-sensitive company announcements or qualitative material. Simply Wall St has no position in any stocks mentioned.