
For many investors, the main point of stock picking is to generate higher returns than the overall market. But if you try your hand at stock picking, your risk returning less than the market. Unfortunately, that's been the case for longer term Brady Corporation (NYSE:BRC) shareholders, since the share price is down 21% in the last three years, falling well short of the market return of around 37%. Even worse, it's down 15% in about a month, which isn't fun at all. We do note, however, that the broader market is down 8.0% in that period, and this may have weighed on the share price.
So let's have a look and see if the longer term performance of the company has been in line with the underlying business' progress.
View our latest analysis for Brady
To paraphrase Benjamin Graham: Over the short term the market is a voting machine, but over the long term it's a weighing machine. One way to examine how market sentiment has changed over time is to look at the interaction between a company's share price and its earnings per share (EPS).
Although the share price is down over three years, Brady actually managed to grow EPS by 6.4% per year in that time. Given the share price reaction, one might suspect that EPS is not a good guide to the business performance during the period (perhaps due to a one-off loss or gain). Alternatively, growth expectations may have been unreasonable in the past.
It's worth taking a look at other metrics, because the EPS growth doesn't seem to match with the falling share price.
Revenue is actually up 4.2% over the three years, so the share price drop doesn't seem to hinge on revenue, either. It's probably worth investigating Brady further; while we may be missing something on this analysis, there might also be an opportunity.
You can see below how earnings and revenue have changed over time (discover the exact values by clicking on the image).
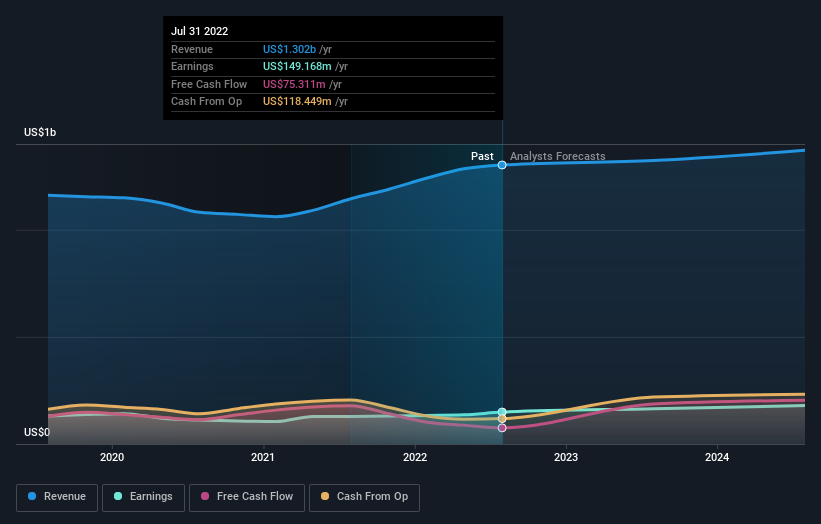 NYSE:BRC Earnings and Revenue Growth September 15th 2022
We like that insiders have been buying shares in the last twelve months. Having said that, most people consider earnings and revenue growth trends to be a more meaningful guide to the business. You can see what analysts are predicting for Brady in this interactive graph of future profit estimates.
What About Dividends?
As well as measuring the share price return, investors should also consider the total shareholder return (TSR). The TSR is a return calculation that accounts for the value of cash dividends (assuming that any dividend received was reinvested) and the calculated value of any discounted capital raisings and spin-offs. It's fair to say that the TSR gives a more complete picture for stocks that pay a dividend. In the case of Brady, it has a TSR of -17% for the last 3 years. That exceeds its share price return that we previously mentioned. The dividends paid by the company have thusly boosted the total shareholder return.
A Different Perspective
While it's certainly disappointing to see that Brady shares lost 13% throughout the year, that wasn't as bad as the market loss of 16%. Of course, the long term returns are far more important and the good news is that over five years, the stock has returned 5% for each year. In the best case scenario the last year is just a temporary blip on the journey to a brighter future. Investors who like to make money usually check up on insider purchases, such as the price paid, and total amount bought. You can find out about the insider purchases of Brady by clicking this link.
If you like to buy stocks alongside management, then you might just love this free list of companies. (Hint: insiders have been buying them).
Please note, the market returns quoted in this article reflect the market weighted average returns of stocks that currently trade on US exchanges.
Have feedback on this article? Concerned about the content? Get in touch with us directly. Alternatively, email editorial-team (at) simplywallst.com.
This article by Simply Wall St is general in nature. We provide commentary based on historical data and analyst forecasts only using an unbiased methodology and our articles are not intended to be financial advice. It does not constitute a recommendation to buy or sell any stock, and does not take account of your objectives, or your financial situation. We aim to bring you long-term focused analysis driven by fundamental data. Note that our analysis may not factor in the latest price-sensitive company announcements or qualitative material. Simply Wall St has no position in any stocks mentioned.