
Howard Marks put it nicely when he said that, rather than worrying about share price volatility, 'The possibility of permanent loss is the risk I worry about... and every practical investor I know worries about.' It's only natural to consider a company's balance sheet when you examine how risky it is, since debt is often involved when a business collapses. We note that Shangri-La Asia Limited (HKG:69) does have debt on its balance sheet. But the more important question is: how much risk is that debt creating?
Why Does Debt Bring Risk?
Debt and other liabilities become risky for a business when it cannot easily fulfill those obligations, either with free cash flow or by raising capital at an attractive price. Part and parcel of capitalism is the process of 'creative destruction' where failed businesses are mercilessly liquidated by their bankers. However, a more common (but still painful) scenario is that it has to raise new equity capital at a low price, thus permanently diluting shareholders. Having said that, the most common situation is where a company manages its debt reasonably well - and to its own advantage. When we examine debt levels, we first consider both cash and debt levels, together.
See our latest analysis for Shangri-La Asia
What Is Shangri-La Asia's Debt?
As you can see below, Shangri-La Asia had US$5.61b of debt, at June 2022, which is about the same as the year before. You can click the chart for greater detail. However, because it has a cash reserve of US$668.6m, its net debt is less, at about US$4.94b.
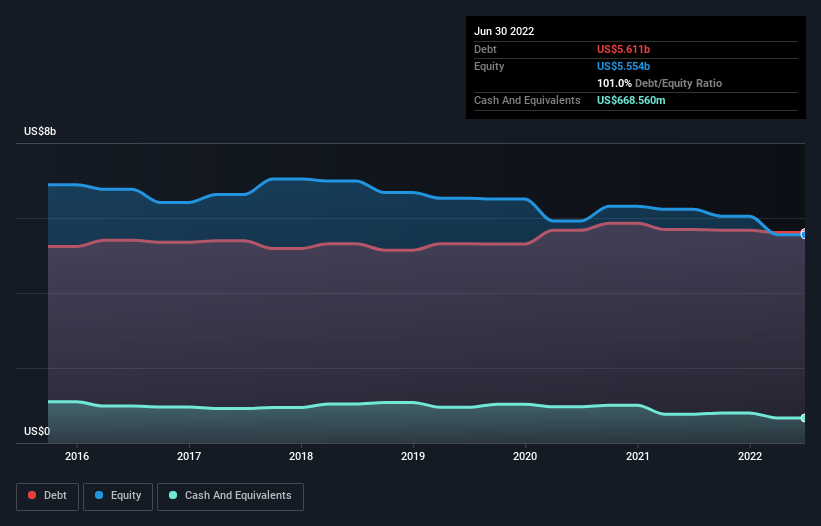 SEHK:69 Debt to Equity History September 8th 2022
How Healthy Is Shangri-La Asia's Balance Sheet?
According to the last reported balance sheet, Shangri-La Asia had liabilities of US$1.33b due within 12 months, and liabilities of US$5.80b due beyond 12 months. Offsetting this, it had US$668.6m in cash and US$284.9m in receivables that were due within 12 months. So its liabilities outweigh the sum of its cash and (near-term) receivables by US$6.17b.
This deficit casts a shadow over the US$2.77b company, like a colossus towering over mere mortals. So we definitely think shareholders need to watch this one closely. At the end of the day, Shangri-La Asia would probably need a major re-capitalization if its creditors were to demand repayment. The balance sheet is clearly the area to focus on when you are analysing debt. But it is future earnings, more than anything, that will determine Shangri-La Asia's ability to maintain a healthy balance sheet going forward. So if you want to see what the professionals think, you might find this free report on analyst profit forecasts to be interesting.
In the last year Shangri-La Asia wasn't profitable at an EBIT level, but managed to grow its revenue by 18%, to US$1.3b. We usually like to see faster growth from unprofitable companies, but each to their own.
Caveat Emptor
Importantly, Shangri-La Asia had an earnings before interest and tax (EBIT) loss over the last year. Its EBIT loss was a whopping US$309m. When we look at that alongside the significant liabilities, we're not particularly confident about the company. We'd want to see some strong near-term improvements before getting too interested in the stock. Not least because it had negative free cash flow of US$221m over the last twelve months. So suffice it to say we consider the stock to be risky. For riskier companies like Shangri-La Asia I always like to keep an eye on whether insiders are buying or selling. So click here if you want to find out for yourself.
If you're interested in investing in businesses that can grow profits without the burden of debt, then check out this free list of growing businesses that have net cash on the balance sheet.
Have feedback on this article? Concerned about the content? Get in touch with us directly. Alternatively, email editorial-team (at) simplywallst.com.
This article by Simply Wall St is general in nature. We provide commentary based on historical data and analyst forecasts only using an unbiased methodology and our articles are not intended to be financial advice. It does not constitute a recommendation to buy or sell any stock, and does not take account of your objectives, or your financial situation. We aim to bring you long-term focused analysis driven by fundamental data. Note that our analysis may not factor in the latest price-sensitive company announcements or qualitative material. Simply Wall St has no position in any stocks mentioned.