
Finding a business that has the potential to grow substantially is not easy, but it is possible if we look at a few key financial metrics. Typically, we'll want to notice a trend of growing return on capital employed (ROCE) and alongside that, an expanding base of capital employed. Put simply, these types of businesses are compounding machines, meaning they are continually reinvesting their earnings at ever-higher rates of return. With that in mind, we've noticed some promising trends at Legendary Group (HKG:8195) so let's look a bit deeper.
Return On Capital Employed (ROCE): What Is It?
For those that aren't sure what ROCE is, it measures the amount of pre-tax profits a company can generate from the capital employed in its business. To calculate this metric for Legendary Group, this is the formula:
Return on Capital Employed = Earnings Before Interest and Tax (EBIT) ÷ (Total Assets - Current Liabilities)
 0.13 = HK$34m ÷ (HK$329m - HK$66m) (Based on the trailing twelve months to March 2022).
Thus, Legendary Group has an ROCE of 13%. In absolute terms, that's a satisfactory return, but compared to the Luxury industry average of 9.4% it's much better.
View our latest analysis for Legendary Group
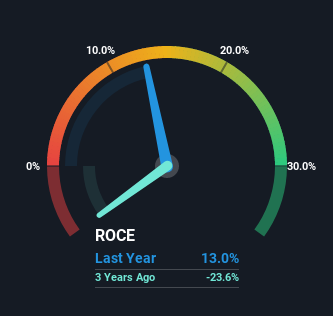 SEHK:8195 Return on Capital Employed August 10th 2022
While the past is not representative of the future, it can be helpful to know how a company has performed historically, which is why we have this chart above. If you're interested in investigating Legendary Group's past further, check out this free graph of past earnings, revenue and cash flow.
What Can We Tell From Legendary Group's ROCE Trend?
Like most people, we're pleased that Legendary Group is now generating some pretax earnings. The company was generating losses five years ago, but now it's turned around, earning 13% which is no doubt a relief for some early shareholders. In regards to capital employed, Legendary Group is using 36% less capital than it was five years ago, which on the surface, can indicate that the business has become more efficient at generating these returns. This could potentially mean that the company is selling some of its assets.
For the record though, there was a noticeable increase in the company's current liabilities over the period, so we would attribute some of the ROCE growth to that. The current liabilities has increased to 20% of total assets, so the business is now more funded by the likes of its suppliers or short-term creditors. It's worth keeping an eye on this because as the percentage of current liabilities to total assets increases, some aspects of risk also increase.
What We Can Learn From Legendary Group's ROCE
In a nutshell, we're pleased to see that Legendary Group has been able to generate higher returns from less capital. Considering the stock has delivered 25% to its stockholders over the last five years, it may be fair to think that investors aren't fully aware of the promising trends yet. So exploring more about this stock could uncover a good opportunity, if the valuation and other metrics stack up.
If you want to know some of the risks facing Legendary Group we've found 3 warning signs (1 is potentially serious!) that you should be aware of before investing here.
If you want to search for solid companies with great earnings, check out this free list of companies with good balance sheets and impressive returns on equity.
Have feedback on this article? Concerned about the content? Get in touch with us directly. Alternatively, email editorial-team (at) simplywallst.com.
This article by Simply Wall St is general in nature. We provide commentary based on historical data and analyst forecasts only using an unbiased methodology and our articles are not intended to be financial advice. It does not constitute a recommendation to buy or sell any stock, and does not take account of your objectives, or your financial situation. We aim to bring you long-term focused analysis driven by fundamental data. Note that our analysis may not factor in the latest price-sensitive company announcements or qualitative material. Simply Wall St has no position in any stocks mentioned.