
It might seem bad, but the worst that can happen when you buy a stock (without leverage) is that its share price goes to zero. But in contrast you can make much more than 100% if the company does well. For instance the Steel Dynamics, Inc. (NASDAQ:STLD) share price is 188% higher than it was three years ago. Most would be happy with that. In more good news, the share price has risen 19% in thirty days. This could be related to the recent financial results that were recently released - you could check the most recent data by reading our company report.
So let's investigate and see if the longer term performance of the company has been in line with the underlying business' progress.
See our latest analysis for Steel Dynamics
While markets are a powerful pricing mechanism, share prices reflect investor sentiment, not just underlying business performance. By comparing earnings per share (EPS) and share price changes over time, we can get a feel for how investor attitudes to a company have morphed over time.
Steel Dynamics was able to grow its EPS at 72% per year over three years, sending the share price higher. The average annual share price increase of 42% is actually lower than the EPS growth. So one could reasonably conclude that the market has cooled on the stock. We'd venture the lowish P/E ratio of 3.27 also reflects the negative sentiment around the stock.
The image below shows how EPS has tracked over time (if you click on the image you can see greater detail).
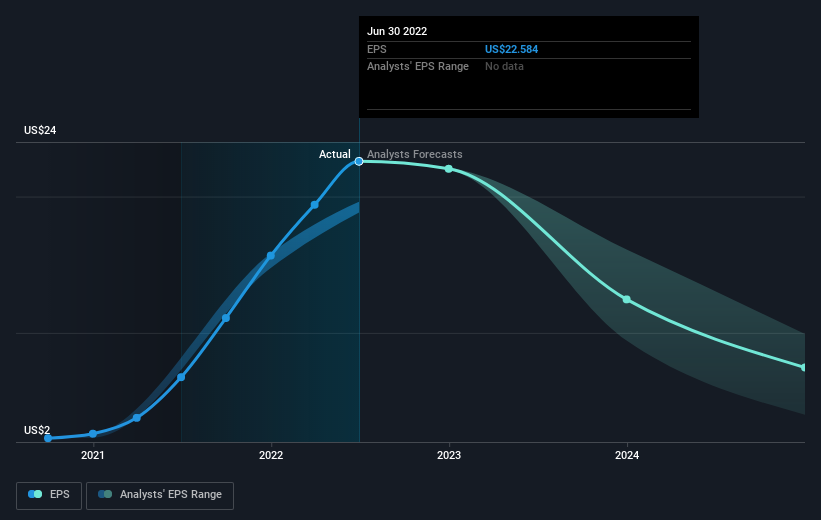 NasdaqGS:STLD Earnings Per Share Growth August 9th 2022
It is of course excellent to see how Steel Dynamics has grown profits over the years, but the future is more important for shareholders. This free interactive report on Steel Dynamics' balance sheet strength is a great place to start, if you want to investigate the stock further.
What About Dividends?
It is important to consider the total shareholder return, as well as the share price return, for any given stock. The TSR is a return calculation that accounts for the value of cash dividends (assuming that any dividend received was reinvested) and the calculated value of any discounted capital raisings and spin-offs. Arguably, the TSR gives a more comprehensive picture of the return generated by a stock. We note that for Steel Dynamics the TSR over the last 3 years was 212%, which is better than the share price return mentioned above. The dividends paid by the company have thusly boosted the total shareholder return.
A Different Perspective
We're pleased to report that Steel Dynamics shareholders have received a total shareholder return of 24% over one year. And that does include the dividend. That's better than the annualised return of 20% over half a decade, implying that the company is doing better recently. Someone with an optimistic perspective could view the recent improvement in TSR as indicating that the business itself is getting better with time. I find it very interesting to look at share price over the long term as a proxy for business performance. But to truly gain insight, we need to consider other information, too. For example, we've discovered 3 warning signs for Steel Dynamics (2 can't be ignored!) that you should be aware of before investing here.
If you would prefer to check out another company -- one with potentially superior financials -- then do not miss this free list of companies that have proven they can grow earnings.
Please note, the market returns quoted in this article reflect the market weighted average returns of stocks that currently trade on US exchanges.
Have feedback on this article? Concerned about the content? Get in touch with us directly. Alternatively, email editorial-team (at) simplywallst.com.
This article by Simply Wall St is general in nature. We provide commentary based on historical data and analyst forecasts only using an unbiased methodology and our articles are not intended to be financial advice. It does not constitute a recommendation to buy or sell any stock, and does not take account of your objectives, or your financial situation. We aim to bring you long-term focused analysis driven by fundamental data. Note that our analysis may not factor in the latest price-sensitive company announcements or qualitative material. Simply Wall St has no position in any stocks mentioned.