
If you want to compound wealth in the stock market, you can do so by buying an index fund. But in our experience, buying the right stocks can give your wealth a significant boost. For example, the Chesapeake Utilities Corporation (NYSE:CPK) share price is up 69% in the last five years, slightly above the market return. The 1.4% share price rise over the last year is decent, but not great.
While this past week has detracted from the company's five-year return, let's look at the recent trends of the underlying business and see if the gains have been in alignment.
See our latest analysis for Chesapeake Utilities
While markets are a powerful pricing mechanism, share prices reflect investor sentiment, not just underlying business performance. One flawed but reasonable way to assess how sentiment around a company has changed is to compare the earnings per share (EPS) with the share price.
During five years of share price growth, Chesapeake Utilities achieved compound earnings per share (EPS) growth of 14% per year. This EPS growth is higher than the 11% average annual increase in the share price. So one could conclude that the broader market has become more cautious towards the stock.
You can see below how EPS has changed over time (discover the exact values by clicking on the image).
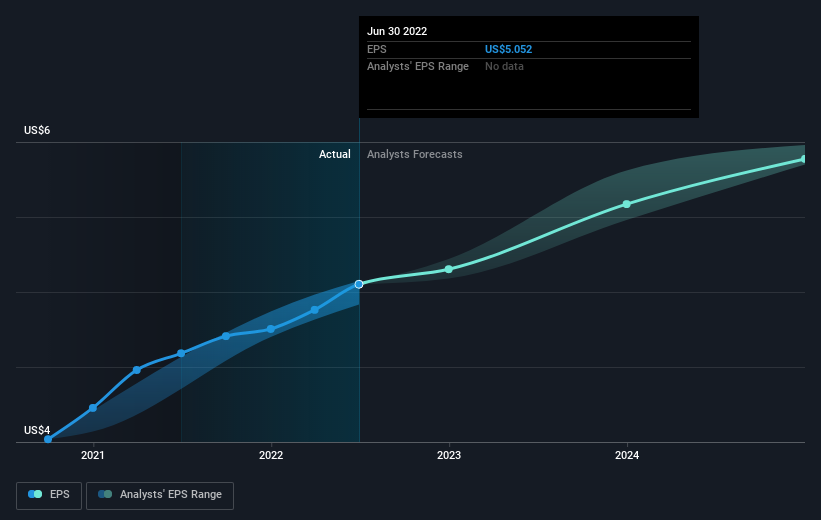 NYSE:CPK Earnings Per Share Growth August 8th 2022
We're pleased to report that the CEO is remunerated more modestly than most CEOs at similarly capitalized companies. But while CEO remuneration is always worth checking, the really important question is whether the company can grow earnings going forward. Before buying or selling a stock, we always recommend a close examination of historic growth trends, available here..
What About Dividends?
It is important to consider the total shareholder return, as well as the share price return, for any given stock. The TSR is a return calculation that accounts for the value of cash dividends (assuming that any dividend received was reinvested) and the calculated value of any discounted capital raisings and spin-offs. It's fair to say that the TSR gives a more complete picture for stocks that pay a dividend. In the case of Chesapeake Utilities, it has a TSR of 84% for the last 5 years. That exceeds its share price return that we previously mentioned. And there's no prize for guessing that the dividend payments largely explain the divergence!
A Different Perspective
It's nice to see that Chesapeake Utilities shareholders have received a total shareholder return of 2.9% over the last year. And that does include the dividend. Having said that, the five-year TSR of 13% a year, is even better. Potential buyers might understandably feel they've missed the opportunity, but it's always possible business is still firing on all cylinders. I find it very interesting to look at share price over the long term as a proxy for business performance. But to truly gain insight, we need to consider other information, too. Even so, be aware that Chesapeake Utilities is showing 2 warning signs in our investment analysis , and 1 of those shouldn't be ignored...
Of course Chesapeake Utilities may not be the best stock to buy. So you may wish to see this free collection of growth stocks.
Please note, the market returns quoted in this article reflect the market weighted average returns of stocks that currently trade on US exchanges.
Have feedback on this article? Concerned about the content? Get in touch with us directly. Alternatively, email editorial-team (at) simplywallst.com.
This article by Simply Wall St is general in nature. We provide commentary based on historical data and analyst forecasts only using an unbiased methodology and our articles are not intended to be financial advice. It does not constitute a recommendation to buy or sell any stock, and does not take account of your objectives, or your financial situation. We aim to bring you long-term focused analysis driven by fundamental data. Note that our analysis may not factor in the latest price-sensitive company announcements or qualitative material. Simply Wall St has no position in any stocks mentioned.