
It is hard to get excited after looking at Tencent Holdings' (HKG:700) recent performance, when its stock has declined 14% over the past month. However, a closer look at its sound financials might cause you to think again. Given that fundamentals usually drive long-term market outcomes, the company is worth looking at. Particularly, we will be paying attention to Tencent Holdings' ROE today.
Return on equity or ROE is an important factor to be considered by a shareholder because it tells them how effectively their capital is being reinvested. Put another way, it reveals the company's success at turning shareholder investments into profits.
See our latest analysis for Tencent Holdings
How Is ROE Calculated?
The formula for return on equity is:
Return on Equity = Net Profit (from continuing operations) ÷ Shareholders' Equity
So, based on the above formula, the ROE for Tencent Holdings is:
24% = CN¥203b ÷ CN¥845b (Based on the trailing twelve months to March 2022).
The 'return' refers to a company's earnings over the last year. So, this means that for every HK$1 of its shareholder's investments, the company generates a profit of HK$0.24.
What Has ROE Got To Do With Earnings Growth?
So far, we've learned that ROE is a measure of a company's profitability. We now need to evaluate how much profit the company reinvests or "retains" for future growth which then gives us an idea about the growth potential of the company. Assuming everything else remains unchanged, the higher the ROE and profit retention, the higher the growth rate of a company compared to companies that don't necessarily bear these characteristics.
A Side By Side comparison of Tencent Holdings' Earnings Growth And 24% ROE
First thing first, we like that Tencent Holdings has an impressive ROE. Second, a comparison with the average ROE reported by the industry of 9.2% also doesn't go unnoticed by us. As a result, Tencent Holdings' exceptional 28% net income growth seen over the past five years, doesn't come as a surprise.
We then compared Tencent Holdings' net income growth with the industry and we're pleased to see that the company's growth figure is higher when compared with the industry which has a growth rate of 23% in the same period.
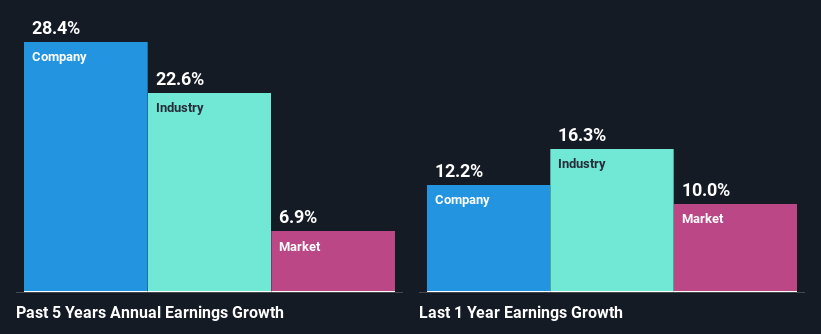 SEHK:700 Past Earnings Growth July 25th 2022
Earnings growth is an important metric to consider when valuing a stock. What investors need to determine next is if the expected earnings growth, or the lack of it, is already built into the share price. Doing so will help them establish if the stock's future looks promising or ominous. Is 700 fairly valued? This infographic on the company's intrinsic value has everything you need to know.
Is Tencent Holdings Making Efficient Use Of Its Profits?
Tencent Holdings has a really low three-year median payout ratio of 8.3%, meaning that it has the remaining 92% left over to reinvest into its business. So it looks like Tencent Holdings is reinvesting profits heavily to grow its business, which shows in its earnings growth.
Besides, Tencent Holdings has been paying dividends for at least ten years or more. This shows that the company is committed to sharing profits with its shareholders. Upon studying the latest analysts' consensus data, we found that the company is expected to keep paying out approximately 9.7% of its profits over the next three years. Regardless, Tencent Holdings' ROE is speculated to decline to 14% despite there being no anticipated change in its payout ratio.
Summary
In total, we are pretty happy with Tencent Holdings' performance. Particularly, we like that the company is reinvesting heavily into its business, and at a high rate of return. Unsurprisingly, this has led to an impressive earnings growth. That being so, a study of the latest analyst forecasts show that the company is expected to see a slowdown in its future earnings growth. To know more about the latest analysts predictions for the company, check out this visualization of analyst forecasts for the company.
Have feedback on this article? Concerned about the content? Get in touch with us directly. Alternatively, email editorial-team (at) simplywallst.com.
This article by Simply Wall St is general in nature. We provide commentary based on historical data and analyst forecasts only using an unbiased methodology and our articles are not intended to be financial advice. It does not constitute a recommendation to buy or sell any stock, and does not take account of your objectives, or your financial situation. We aim to bring you long-term focused analysis driven by fundamental data. Note that our analysis may not factor in the latest price-sensitive company announcements or qualitative material. Simply Wall St has no position in any stocks mentioned.