
This week we saw the Redco Properties Group Limited (HKG:1622) share price climb by 18%. But that doesn't change the fact that the returns over the last three years have been less than pleasing. In fact, the share price is down 30% in the last three years, falling well short of the market return.
Although the past week has been more reassuring for shareholders, they're still in the red over the last three years, so let's see if the underlying business has been responsible for the decline.
See our latest analysis for Redco Properties Group
While the efficient markets hypothesis continues to be taught by some, it has been proven that markets are over-reactive dynamic systems, and investors are not always rational. One way to examine how market sentiment has changed over time is to look at the interaction between a company's share price and its earnings per share (EPS).
During the three years that the share price fell, Redco Properties Group's earnings per share (EPS) dropped by 3.7% each year. The share price decline of 11% is actually steeper than the EPS slippage. So it seems the market was too confident about the business, in the past. The less favorable sentiment is reflected in its current P/E ratio of 7.59.
The graphic below depicts how EPS has changed over time (unveil the exact values by clicking on the image).
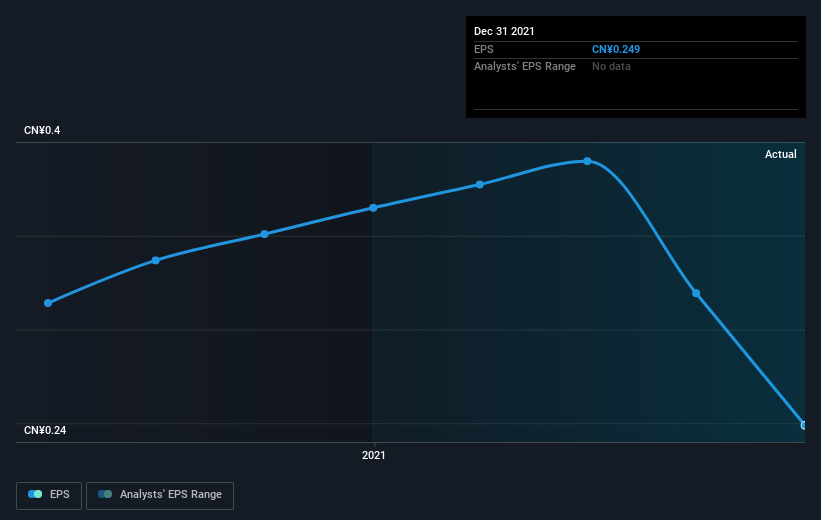 SEHK:1622 Earnings Per Share Growth July 20th 2022
We like that insiders have been buying shares in the last twelve months. Having said that, most people consider earnings and revenue growth trends to be a more meaningful guide to the business. It might be well worthwhile taking a look at our free report on Redco Properties Group's earnings, revenue and cash flow.
What about the Total Shareholder Return (TSR)?
We'd be remiss not to mention the difference between Redco Properties Group's total shareholder return (TSR) and its share price return. Arguably the TSR is a more complete return calculation because it accounts for the value of dividends (as if they were reinvested), along with the hypothetical value of any discounted capital that have been offered to shareholders. Redco Properties Group's TSR of was a loss of 28% for the 3 years. That wasn't as bad as its share price return, because it has paid dividends.
A Different Perspective
While it's certainly disappointing to see that Redco Properties Group shares lost 5.6% throughout the year, that wasn't as bad as the market loss of 22%. Given the total loss of 4% per year over five years, it seems returns have deteriorated in the last twelve months. While some investors do well specializing in buying companies that are struggling (but nonetheless undervalued), don't forget that Buffett said that 'turnarounds seldom turn'. I find it very interesting to look at share price over the long term as a proxy for business performance. But to truly gain insight, we need to consider other information, too. For instance, we've identified 3 warning signs for Redco Properties Group (1 is a bit concerning) that you should be aware of.
Redco Properties Group is not the only stock insiders are buying. So take a peek at this free list of growing companies with insider buying.
Please note, the market returns quoted in this article reflect the market weighted average returns of stocks that currently trade on HK exchanges.
Have feedback on this article? Concerned about the content? Get in touch with us directly. Alternatively, email editorial-team (at) simplywallst.com.
This article by Simply Wall St is general in nature. We provide commentary based on historical data and analyst forecasts only using an unbiased methodology and our articles are not intended to be financial advice. It does not constitute a recommendation to buy or sell any stock, and does not take account of your objectives, or your financial situation. We aim to bring you long-term focused analysis driven by fundamental data. Note that our analysis may not factor in the latest price-sensitive company announcements or qualitative material. Simply Wall St has no position in any stocks mentioned.