
We think that it's fair to say that the possibility of finding fantastic multi-year winners is what motivates many investors. But when you hold the right stock for the right time period, the rewards can be truly huge. Take, for example, the Samudera Shipping Line Ltd (SGX:S56) share price, which skyrocketed 508% over three years. In more good news, the share price has risen 26% in thirty days. Anyone who held for that rewarding ride would probably be keen to talk about it.
Since it's been a strong week for Samudera Shipping Line shareholders, let's have a look at trend of the longer term fundamentals.
See our latest analysis for Samudera Shipping Line
In his essay The Superinvestors of Graham-and-Doddsville Warren Buffett described how share prices do not always rationally reflect the value of a business. One way to examine how market sentiment has changed over time is to look at the interaction between a company's share price and its earnings per share (EPS).
During three years of share price growth, Samudera Shipping Line achieved compound earnings per share growth of 150% per year. The average annual share price increase of 83% is actually lower than the EPS growth. Therefore, it seems the market has moderated its expectations for growth, somewhat. We'd venture the lowish P/E ratio of 2.86 also reflects the negative sentiment around the stock.
The company's earnings per share (over time) is depicted in the image below (click to see the exact numbers).
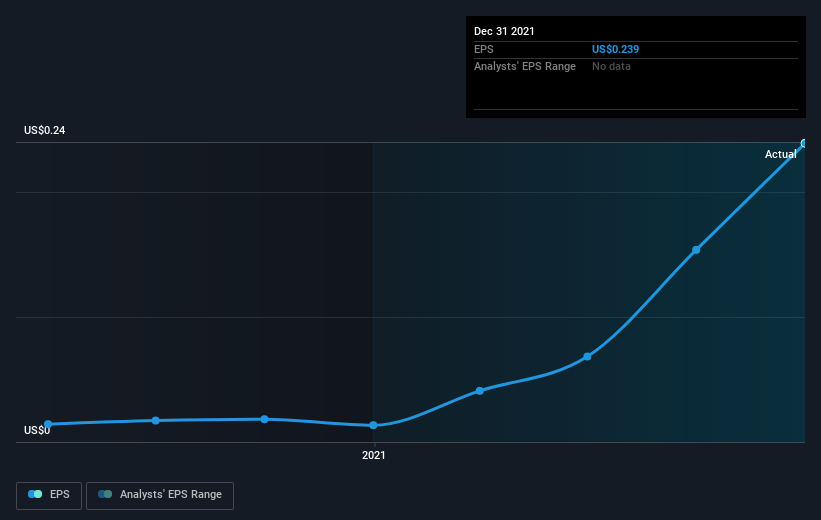 SGX:S56 Earnings Per Share Growth July 19th 2022
This free interactive report on Samudera Shipping Line's earnings, revenue and cash flow is a great place to start, if you want to investigate the stock further.
What About Dividends?
As well as measuring the share price return, investors should also consider the total shareholder return (TSR). Whereas the share price return only reflects the change in the share price, the TSR includes the value of dividends (assuming they were reinvested) and the benefit of any discounted capital raising or spin-off. It's fair to say that the TSR gives a more complete picture for stocks that pay a dividend. In the case of Samudera Shipping Line, it has a TSR of 680% for the last 3 years. That exceeds its share price return that we previously mentioned. This is largely a result of its dividend payments!
A Different Perspective
It's nice to see that Samudera Shipping Line shareholders have received a total shareholder return of 180% over the last year. That's including the dividend. Since the one-year TSR is better than the five-year TSR (the latter coming in at 50% per year), it would seem that the stock's performance has improved in recent times. Given the share price momentum remains strong, it might be worth taking a closer look at the stock, lest you miss an opportunity. I find it very interesting to look at share price over the long term as a proxy for business performance. But to truly gain insight, we need to consider other information, too. Case in point: We've spotted 2 warning signs for Samudera Shipping Line you should be aware of.
If you would prefer to check out another company -- one with potentially superior financials -- then do not miss this free list of companies that have proven they can grow earnings.
Please note, the market returns quoted in this article reflect the market weighted average returns of stocks that currently trade on SG exchanges.
Have feedback on this article? Concerned about the content? Get in touch with us directly. Alternatively, email editorial-team (at) simplywallst.com.
This article by Simply Wall St is general in nature. We provide commentary based on historical data and analyst forecasts only using an unbiased methodology and our articles are not intended to be financial advice. It does not constitute a recommendation to buy or sell any stock, and does not take account of your objectives, or your financial situation. We aim to bring you long-term focused analysis driven by fundamental data. Note that our analysis may not factor in the latest price-sensitive company announcements or qualitative material. Simply Wall St has no position in any stocks mentioned.