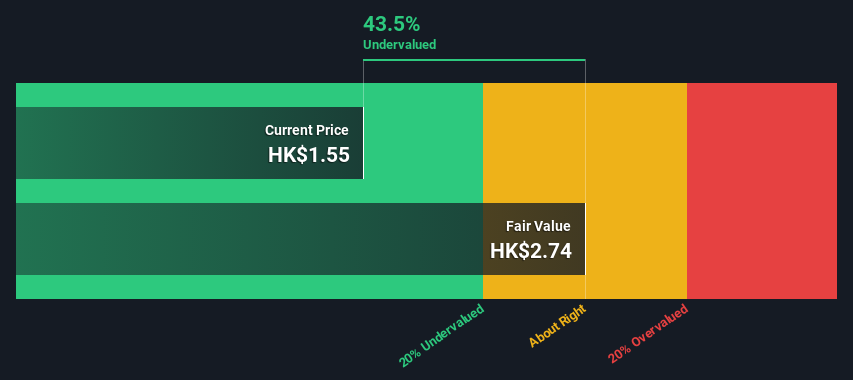
JS Global Lifestyle's estimated fair value is HK$2.74 based on 2 Stage Free Cash Flow to Equity
Current share price of HK$1.55 suggests JS Global Lifestyle is potentially 44% undervalued
Analyst price target for 1691 is US$1.77 which is 36% below our fair value estimate
How far off is JS Global Lifestyle Company Limited (HKG:1691) from its intrinsic value? Using the most recent financial data, we'll take a look at whether the stock is fairly priced by taking the expected future cash flows and discounting them to their present value. One way to achieve this is by employing the Discounted Cash Flow (DCF) model. Before you think you won't be able to understand it, just read on! It's actually much less complex than you'd imagine.
We generally believe that a company's value is the present value of all of the cash it will generate in the future. However, a DCF is just one valuation metric among many, and it is not without flaws. If you still have some burning questions about this type of valuation, take a look at the Simply Wall St analysis model.
What's The Estimated Valuation?
We are going to use a two-stage DCF model, which, as the name states, takes into account two stages of growth. The first stage is generally a higher growth period which levels off heading towards the terminal value, captured in the second 'steady growth' period. To begin with, we have to get estimates of the next ten years of cash flows. Where possible we use analyst estimates, but when these aren't available we extrapolate the previous free cash flow (FCF) from the last estimate or reported value. We assume companies with shrinking free cash flow will slow their rate of shrinkage, and that companies with growing free cash flow will see their growth rate slow, over this period. We do this to reflect that growth tends to slow more in the early years than it does in later years.
Generally we assume that a dollar today is more valuable than a dollar in the future, and so the sum of these future cash flows is then discounted to today's value:
10-year free cash flow (FCF) forecast
2024
2025
2026
2027
2028
2029
2030
2031
2032
2033
Levered FCF ($, Millions)
US$181.5m
US$209.5m
US$153.2m
US$125.3m
US$110.1m
US$101.4m
US$96.4m
US$93.7m
US$92.4m
US$92.1m
Growth Rate Estimate Source
Analyst x4
Analyst x4
Est @ -26.89%
Est @ -18.21%
Est @ -12.14%
Est @ -7.88%
Est @ -4.91%
Est @ -2.82%
Est @ -1.36%
Est @ -0.34%
Present Value ($, Millions) Discounted @ 11%
US$164
US$171
US$113
US$83.8
US$66.6
US$55.5
US$47.7
US$41.9
US$37.4
US$33.7
("Est" = FCF growth rate estimated by Simply Wall St) Present Value of 10-year Cash Flow (PVCF) = US$816m
We now need to calculate the Terminal Value, which accounts for all the future cash flows after this ten year period. The Gordon Growth formula is used to calculate Terminal Value at a future annual growth rate equal to the 5-year average of the 10-year government bond yield of 2.0%. We discount the terminal cash flows to today's value at a cost of equity of 11%.
Present Value of Terminal Value (PVTV)= TV / (1 + r)10= US$1.1b÷ ( 1 + 11%)10= US$404m
The total value, or equity value, is then the sum of the present value of the future cash flows, which in this case is US$1.2b. To get the intrinsic value per share, we divide this by the total number of shares outstanding. Compared to the current share price of HK$1.6, the company appears quite undervalued at a 44% discount to where the stock price trades currently. Remember though, that this is just an approximate valuation, and like any complex formula - garbage in, garbage out.
SEHK:1691 Discounted Cash Flow February 21st 2024
The Assumptions
Now the most important inputs to a discounted cash flow are the discount rate, and of course, the actual cash flows. Part of investing is coming up with your own evaluation of a company's future performance, so try the calculation yourself and check your own assumptions. The DCF also does not consider the possible cyclicality of an industry, or a company's future capital requirements, so it does not give a full picture of a company's potential performance. Given that we are looking at JS Global Lifestyle as potential shareholders, the cost of equity is used as the discount rate, rather than the cost of capital (or weighted average cost of capital, WACC) which accounts for debt. In this calculation we've used 11%, which is based on a levered beta of 1.556. Beta is a measure of a stock's volatility, compared to the market as a whole. We get our beta from the industry average beta of globally comparable companies, with an imposed limit between 0.8 and 2.0, which is a reasonable range for a stable business.
SWOT Analysis for JS Global Lifestyle
Strength
Earnings growth over the past year exceeded the industry.
Debt is not viewed as a risk.
Dividends are covered by earnings and cash flows.
Dividend information for 1691.
Weakness
Earnings growth over the past year is below its 5-year average.
Dividend is low compared to the top 25% of dividend payers in the Consumer Durables market.
Opportunity
Trading below our estimate of fair value by more than 20%.
Threat
Annual earnings are forecast to decline for the next 3 years.
What else are analysts forecasting for 1691?
Looking Ahead:
Valuation is only one side of the coin in terms of building your investment thesis, and it ideally won't be the sole piece of analysis you scrutinize for a company. DCF models are not the be-all and end-all of investment valuation. Rather it should be seen as a guide to "what assumptions need to be true for this stock to be under/overvalued?" For example, changes in the company's cost of equity or the risk free rate can significantly impact the valuation. Can we work out why the company is trading at a discount to intrinsic value? For JS Global Lifestyle, we've compiled three additional items you should further research:
Risks: Every company has them, and we've spotted 2 warning signs for JS Global Lifestyle (of which 1 is concerning!) you should know about.
Management:Have insiders been ramping up their shares to take advantage of the market's sentiment for 1691's future outlook? Check out our management and board analysis with insights on CEO compensation and governance factors.
Other High Quality Alternatives: Do you like a good all-rounder? Explore our interactive list of high quality stocks to get an idea of what else is out there you may be missing!
PS. Simply Wall St updates its DCF calculation for every Hong Kong stock every day, so if you want to find the intrinsic value of any other stock just search here.
Have feedback on this article? Concerned about the content?Get in touch with us directly. Alternatively, email editorial-team (at) simplywallst.com. This article by Simply Wall St is general in nature. We provide commentary based on historical data and analyst forecasts only using an unbiased methodology and our articles are not intended to be financial advice. It does not constitute a recommendation to buy or sell any stock, and does not take account of your objectives, or your financial situation. We aim to bring you long-term focused analysis driven by fundamental data. Note that our analysis may not factor in the latest price-sensitive company announcements or qualitative material. Simply Wall St has no position in any stocks mentioned.
現在,貼現現金流的最重要輸入是貼現率,當然還有實際現金流。投資的一部分是自己對公司未來業績的評估,因此請自己嘗試計算並檢查自己的假設。DCF也沒有考慮一個行業可能的週期性,也沒有考慮公司未來的資本需求,因此它沒有全面反映公司的潛在表現。鑑於我們將JS Global Lifestyle視爲潛在股東,因此使用權益成本作爲貼現率,而不是構成債務的資本成本(或加權平均資本成本,WACC)。在此計算中,我們使用了11%,這是基於1.556的槓桿測試版。Beta是衡量股票與整個市場相比波動性的指標。我們的測試版來自全球可比公司的行業平均貝塔值,設定在0.8到2.0之間,這是一個穩定的業務的合理範圍。
JS 全球生活方式的 SWOT 分析
力量
過去一年的收益增長超過了該行業。
債務不被視爲風險。
股息由收益和現金流支付。
1691 年的股息信息。
弱點
過去一年的收益增長低於其5年平均水平。
與耐用消費品市場前25%的股息支付者相比,股息很低。
機會
交易價格比我們估計的公允價值低20%以上。
威脅
預計未來三年的年收入將下降。
分析師對1691年還有什麼預測?
展望未來:
就建立投資論點而言,估值只是硬幣的一面,理想情況下,它不會是你爲公司仔細研究的唯一分析內容。DCF模型並不是投資估值的萬能藥。相反,它應該被視爲 “需要哪些假設才能低估/高估這隻股票的價值?” 的指南例如,公司權益成本或無風險利率的變化會對估值產生重大影響。我們能否弄清楚爲什麼公司的交易價格低於內在價值?對於JS Global Lifestyle,我們整理了另外三個值得進一步研究的項目:
風險:每家公司都有風險,我們發現了 JS Global Lifestyle 的 2 個警告信號(其中 1 個令人擔憂!)你應該知道。