
Investors Three-year Losses Continue as China International Capital (HKG:3908) Dips a Further 7.7% This Week, Earnings Continue to Decline
Investors Three-year Losses Continue as China International Capital (HKG:3908) Dips a Further 7.7% This Week, Earnings Continue to Decline
If you love investing in stocks you're bound to buy some losers. But the long term shareholders of China International Capital Corporation Limited (HKG:3908) have had an unfortunate run in the last three years. Sadly for them, the share price is down 59% in that time. And over the last year the share price fell 47%, so we doubt many shareholders are delighted. Shareholders have had an even rougher run lately, with the share price down 30% in the last 90 days.
如果你喜歡投資股票,你一定會買入一些輸家。但是,中國國際金融股份有限公司(HKG: 3908)的長期股東在過去三年中出現了不幸的擠兌情況。對他們來說,可悲的是,當時股價下跌了59%。在過去的一年中,股價下跌了47%,因此我們懷疑許多股東是否感到高興。股東們最近的表現更加艱難,股價在過去90天中下跌了30%。
Given the past week has been tough on shareholders, let's investigate the fundamentals and see what we can learn.
鑑於過去一週對股東的處境艱難,讓我們研究一下基本面,看看能學到什麼。
See our latest analysis for China International Capital
查看我們對中國國際資本的最新分析
To paraphrase Benjamin Graham: Over the short term the market is a voting machine, but over the long term it's a weighing machine. By comparing earnings per share (EPS) and share price changes over time, we can get a feel for how investor attitudes to a company have morphed over time.
用本傑明·格雷厄姆的話來說:從短期來看,市場是一臺投票機,但從長遠來看,它是一臺稱重機。通過比較每股收益(EPS)和股價隨時間推移的變化,我們可以了解投資者對公司的態度如何隨着時間的推移而變化。
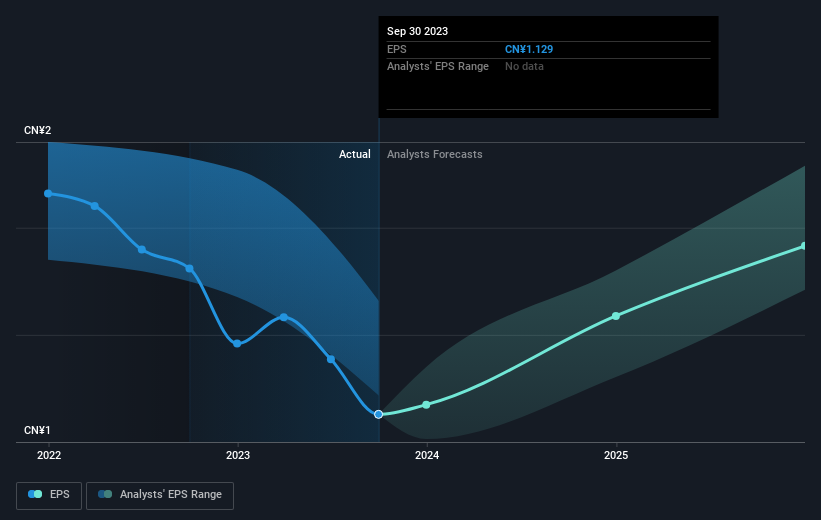
During the three years that the share price fell, China International Capital's earnings per share (EPS) dropped by 5.1% each year. This reduction in EPS is slower than the 26% annual reduction in the share price. So it's likely that the EPS decline has disappointed the market, leaving investors hesitant to buy. The less favorable sentiment is reflected in its current P/E ratio of 7.31.
在股價下跌的三年中,中國國際資本的每股收益(EPS)每年下降5.1%。每股收益的下降低於股價每年26%的降幅。因此,每股收益的下降很可能令市場失望,使投資者對買入猶豫不決。不太樂觀的情緒反映在目前的市盈率7.31上。
You can see below how EPS has changed over time (discover the exact values by clicking on the image).
你可以在下面看到 EPS 是如何隨着時間的推移而發生的變化(點擊圖片發現確切的數值)。
This free interactive report on China International Capital's earnings, revenue and cash flow is a great place to start, if you want to investigate the stock further.
如果你想進一步調查該股,這份關於中國國際資本收益、收入和現金流的免費互動報告是一個很好的起點。
A Different Perspective
不同的視角
While the broader market lost about 21% in the twelve months, China International Capital shareholders did even worse, losing 47% (even including dividends). Having said that, it's inevitable that some stocks will be oversold in a falling market. The key is to keep your eyes on the fundamental developments. Unfortunately, last year's performance may indicate unresolved challenges, given that it was worse than the annualised loss of 6% over the last half decade. Generally speaking long term share price weakness can be a bad sign, though contrarian investors might want to research the stock in hope of a turnaround. Before deciding if you like the current share price, check how China International Capital scores on these 3 valuation metrics.
儘管整個市場在十二個月中下跌了約21%,但中國國際資本股東的表現甚至更糟,損失了47%(甚至包括股息)。話雖如此,在下跌的市場中,一些股票不可避免地會被超賣。關鍵是要密切關注基本發展。不幸的是,去年的表現可能預示着尚未解決的挑戰,因爲它比過去五年中6%的年化虧損還要糟糕。總的來說,長期股價疲軟可能是一個壞兆頭,儘管逆勢投資者可能希望研究該股以期出現轉機。在決定是否喜歡當前股價之前,請查看中國國際資本在這三個估值指標上的得分。
We will like China International Capital better if we see some big insider buys. While we wait, check out this free list of growing companies with considerable, recent, insider buying.
如果我們看到一些大規模的內幕收購,我們會更喜歡中國國際資本。在我們等待的同時,請查看這份免費清單,列出了最近有大量內幕收購的成長型公司。
Please note, the market returns quoted in this article reflect the market weighted average returns of stocks that currently trade on Hong Kong exchanges.
請注意,本文引用的市場回報反映了目前在香港交易所交易的股票的市場加權平均回報率。
Have feedback on this article? Concerned about the content? Get in touch with us directly. Alternatively, email editorial-team (at) simplywallst.com.
This article by Simply Wall St is general in nature. We provide commentary based on historical data and analyst forecasts only using an unbiased methodology and our articles are not intended to be financial advice. It does not constitute a recommendation to buy or sell any stock, and does not take account of your objectives, or your financial situation. We aim to bring you long-term focused analysis driven by fundamental data. Note that our analysis may not factor in the latest price-sensitive company announcements or qualitative material. Simply Wall St has no position in any stocks mentioned.
對這篇文章有反饋嗎?對內容感到擔憂?直接聯繫我們。 或者,給編輯團隊 (at) simplywallst.com 發送電子郵件。
Simply Wall St 的這篇文章本質上是籠統的。我們僅使用公正的方法提供基於歷史數據和分析師預測的評論,我們的文章並非旨在提供財務建議。它不構成買入或賣出任何股票的建議,也沒有考慮到您的目標或財務狀況。我們的目標是爲您提供由基本數據驅動的長期重點分析。請注意,我們的分析可能不會考慮最新的價格敏感型公司公告或定性材料。華爾街只是沒有持有上述任何股票的頭寸。