
Shangri-La Asia (HKG:69) Investors Are Sitting on a Loss of 52% If They Invested Five Years Ago
Shangri-La Asia (HKG:69) Investors Are Sitting on a Loss of 52% If They Invested Five Years Ago
Statistically speaking, long term investing is a profitable endeavour. But along the way some stocks are going to perform badly. For example, after five long years the Shangri-La Asia Limited (HKG:69) share price is a whole 53% lower. That's not a lot of fun for true believers. Shareholders have had an even rougher run lately, with the share price down 17% in the last 90 days. Of course, this share price action may well have been influenced by the 9.9% decline in the broader market, throughout the period.
從統計學上講,長期投資是一項有利可圖的舉措。但在此過程中,一些股票將表現不佳。例如,在漫長的五年之後,香格里拉亞洲有限公司(HKG: 69)的股價下跌了整整53%。對於真正的信徒來說,這並不是什麼好玩的。股東們最近的表現更加艱難,股價在過去90天中下跌了17%。當然,這種股價走勢很可能受到了整個時期大盤下跌9.9%的影響。
With that in mind, it's worth seeing if the company's underlying fundamentals have been the driver of long term performance, or if there are some discrepancies.
考慮到這一點,值得一看公司的基本面是否是長期業績的驅動力,或者是否存在一些差異。
See our latest analysis for Shangri-La Asia
查看我們對亞洲香格里拉的最新分析
While the efficient markets hypothesis continues to be taught by some, it has been proven that markets are over-reactive dynamic systems, and investors are not always rational. By comparing earnings per share (EPS) and share price changes over time, we can get a feel for how investor attitudes to a company have morphed over time.
儘管一些人繼續教導高效市場假說,但事實證明,市場是反應過度的動態系統,投資者並不總是理性的。通過比較每股收益(EPS)和股價隨時間推移的變化,我們可以了解投資者對公司的態度隨着時間的推移而發生了怎樣的變化。
During five years of share price growth, Shangri-La Asia moved from a loss to profitability. That would generally be considered a positive, so we are surprised to see the share price is down. Other metrics might give us a better handle on how its value is changing over time.
在五年的股價增長中,香格里拉亞洲從虧損轉爲盈利。這通常會被視爲利好,因此我們驚訝地看到股價下跌。其他指標可能會讓我們更好地了解其價值如何隨着時間的推移而變化。
Arguably, the revenue drop of 15% a year for half a decade suggests that the company can't grow in the long term. This has probably encouraged some shareholders to sell down the stock.
可以說,五年來每年收入下降15%,這表明該公司無法長期增長。這可能鼓勵了一些股東拋售該股。
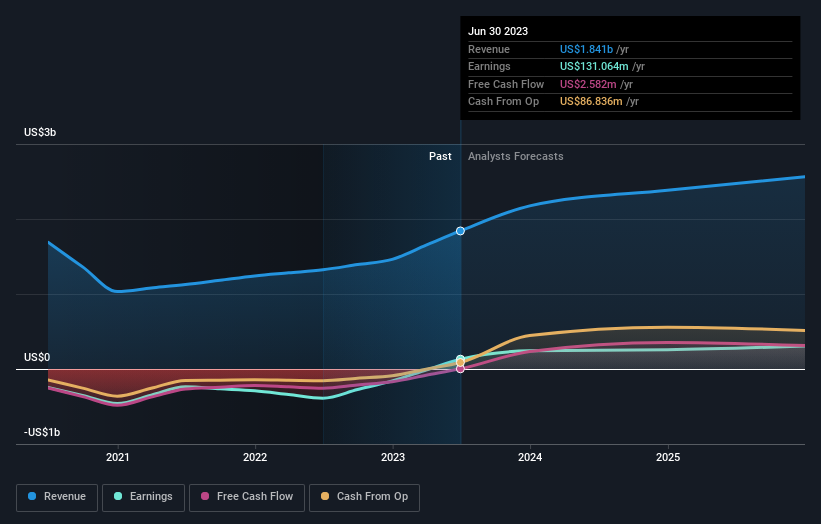
The graphic below depicts how earnings and revenue have changed over time (unveil the exact values by clicking on the image).
下圖描繪了收入和收入隨着時間的推移而發生的變化(點擊圖片顯示確切的數值)。
It is of course excellent to see how Shangri-La Asia has grown profits over the years, but the future is more important for shareholders. Take a more thorough look at Shangri-La Asia's financial health with this free report on its balance sheet.
當然,很高興看到香格里拉亞洲多年來如何實現利潤增長,但未來對股東來說更爲重要。通過這份關於香格里拉亞洲資產負債表的免費報告,更全面地了解香格里拉亞洲的財務狀況。
A Different Perspective
不同的視角
Shangri-La Asia shareholders are up 12% for the year. But that was short of the market average. But at least that's still a gain! Over five years the TSR has been a reduction of 9% per year, over five years. It could well be that the business is stabilizing. It's always interesting to track share price performance over the longer term. But to understand Shangri-La Asia better, we need to consider many other factors. Even so, be aware that Shangri-La Asia is showing 2 warning signs in our investment analysis , and 1 of those is a bit unpleasant...
香格里拉亞洲股東今年上漲了12%。但這低於市場平均水平。但至少這還是個好處!在過去的五年中,股東總回報率在五年內每年下降9%。很可能是業務正在穩定下來。長期跟蹤股價表現總是很有意思的。但是,爲了更好地了解亞洲香格里拉,我們需要考慮許多其他因素。即便如此,請注意,香格里拉亞洲在我們的投資分析中顯示了兩個警告信號,其中一個有點令人不快...
Of course, you might find a fantastic investment by looking elsewhere. So take a peek at this free list of companies we expect will grow earnings.
當然,通過尋找其他地方,你可能會找到一筆不錯的投資。因此,請看一下我們預計收益將增加的這份免費公司名單。
Please note, the market returns quoted in this article reflect the market weighted average returns of stocks that currently trade on Hong Kong exchanges.
請注意,本文引用的市場回報反映了目前在香港交易所交易的股票的市場加權平均回報率。
Have feedback on this article? Concerned about the content? Get in touch with us directly. Alternatively, email editorial-team (at) simplywallst.com.
This article by Simply Wall St is general in nature. We provide commentary based on historical data and analyst forecasts only using an unbiased methodology and our articles are not intended to be financial advice. It does not constitute a recommendation to buy or sell any stock, and does not take account of your objectives, or your financial situation. We aim to bring you long-term focused analysis driven by fundamental data. Note that our analysis may not factor in the latest price-sensitive company announcements or qualitative material. Simply Wall St has no position in any stocks mentioned.
對這篇文章有反饋嗎?對內容感到擔憂?直接聯繫我們。 或者,給編輯團隊 (at) simplywallst.com 發送電子郵件。
Simply Wall St 的這篇文章本質上是籠統的。我們僅使用公正的方法提供基於歷史數據和分析師預測的評論,我們的文章並非旨在提供財務建議。它不構成買入或賣出任何股票的建議,也沒有考慮到您的目標或財務狀況。我們的目標是爲您提供由基本數據驅動的長期重點分析。請注意,我們的分析可能不會考慮最新的價格敏感型公司公告或定性材料。華爾街只是沒有持有上述任何股票的頭寸。