
-
市場
-
產品
-
資訊
-
Moo社區
-
課堂
-
查看更多
-
功能介紹
-
費用費用透明,無最低余額限制
投資選擇、功能介紹、費用相關信息由Moomoo Financial Inc.提供
- English
- 中文繁體
- 中文简体
- 深色
- 淺色
Artisan Partners Asset Management's (NYSE:APAM) One-year Decline in Earnings Translates Into Losses for Shareholders
Artisan Partners Asset Management's (NYSE:APAM) One-year Decline in Earnings Translates Into Losses for Shareholders
While not a mind-blowing move, it is good to see that the Artisan Partners Asset Management Inc. (NYSE:APAM) share price has gained 22% in the last three months. The stock is actually down over the last year. But it did better than its market, which fell 8.1%.
On a more encouraging note the company has added US$104m to its market cap in just the last 7 days, so let's see if we can determine what's driven the one-year loss for shareholders.
Check out our latest analysis for Artisan Partners Asset Management
While the efficient markets hypothesis continues to be taught by some, it has been proven that markets are over-reactive dynamic systems, and investors are not always rational. One imperfect but simple way to consider how the market perception of a company has shifted is to compare the change in the earnings per share (EPS) with the share price movement.
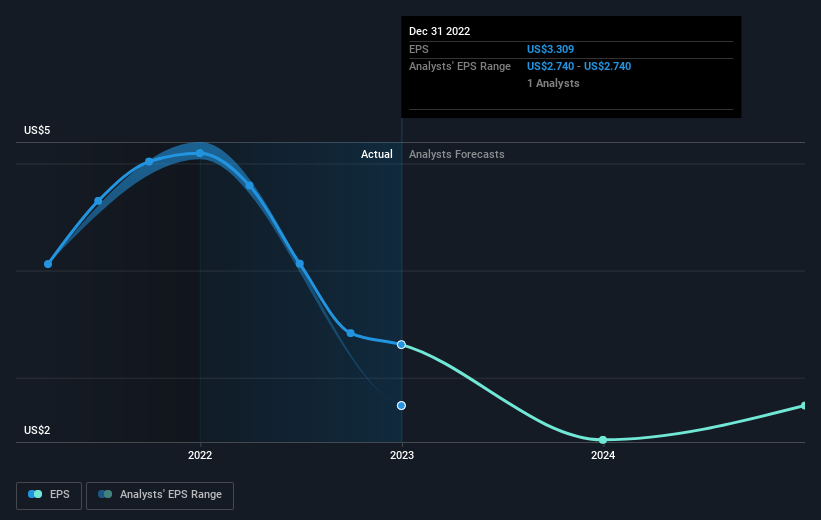
Unfortunately Artisan Partners Asset Management reported an EPS drop of 35% for the last year. The share price fall of 11% isn't as bad as the reduction in earnings per share. So despite the weak per-share profits, some investors are probably relieved the situation wasn't more difficult.
You can see below how EPS has changed over time (discover the exact values by clicking on the image).
Dive deeper into Artisan Partners Asset Management's key metrics by checking this interactive graph of Artisan Partners Asset Management's earnings, revenue and cash flow.
What About Dividends?
When looking at investment returns, it is important to consider the difference between total shareholder return (TSR) and share price return. The TSR is a return calculation that accounts for the value of cash dividends (assuming that any dividend received was reinvested) and the calculated value of any discounted capital raisings and spin-offs. So for companies that pay a generous dividend, the TSR is often a lot higher than the share price return. We note that for Artisan Partners Asset Management the TSR over the last 1 year was -1.5%, which is better than the share price return mentioned above. The dividends paid by the company have thusly boosted the total shareholder return.
A Different Perspective
Although it hurts that Artisan Partners Asset Management returned a loss of 1.5% in the last twelve months, the broader market was actually worse, returning a loss of 8.1%. Of course, the long term returns are far more important and the good news is that over five years, the stock has returned 12% for each year. In the best case scenario the last year is just a temporary blip on the journey to a brighter future. I find it very interesting to look at share price over the long term as a proxy for business performance. But to truly gain insight, we need to consider other information, too. For example, we've discovered 2 warning signs for Artisan Partners Asset Management (1 is a bit concerning!) that you should be aware of before investing here.
If you would prefer to check out another company -- one with potentially superior financials -- then do not miss this free list of companies that have proven they can grow earnings.
Please note, the market returns quoted in this article reflect the market weighted average returns of stocks that currently trade on US exchanges.
Have feedback on this article? Concerned about the content? Get in touch with us directly. Alternatively, email editorial-team (at) simplywallst.com.
This article by Simply Wall St is general in nature. We provide commentary based on historical data and analyst forecasts only using an unbiased methodology and our articles are not intended to be financial advice. It does not constitute a recommendation to buy or sell any stock, and does not take account of your objectives, or your financial situation. We aim to bring you long-term focused analysis driven by fundamental data. Note that our analysis may not factor in the latest price-sensitive company announcements or qualitative material. Simply Wall St has no position in any stocks mentioned.
雖然這不是一個令人興奮的舉動,但很高興看到Artisan Partners資產管理公司。(紐約證券交易所代碼:APAM)股價在過去三個月裡上漲了22%。在過去的一年裡,該公司的股票實際上是下跌的。但它的表現好於其市場,後者下跌了8.1%。
更令人鼓舞的是,僅在過去的7天裡,該公司的市值就增加了1.04億美元,所以讓我們看看我們是否能確定是什麼導致了股東一年的虧損。
查看我們對Artisan Partners Asset Management的最新分析
雖然有效市場假說繼續被一些人傳授,但事實證明,市場是過度反應的動態系統,投資者並不總是理性的。一種不完美但簡單的方法來考慮市場對一家公司的看法是如何改變的,那就是將每股收益(EPS)的變化與股價走勢進行比較。
不幸的是,Artisan Partners Asset Management報告去年每股收益下降了35%。股價下跌11%並不像每股收益減少那麼糟糕。因此,儘管每股利潤疲軟,但一些投資者可能會鬆一口氣,因為情況並沒有變得更困難。
您可以在下面看到EPS是如何隨著時間的推移而變化的(通過單擊圖像來了解確切的值)。
通過查看Artisan Partners Asset Management的收益、收入和現金流的互動圖表,深入瞭解Artisan Partners Asset Management的關鍵指標。
那股息呢?
在考察投資回報時,重要的是要考慮到股東總回報(TSR)和股價回報。TSR是一種回報計算,計入了現金股息的價值(假設收到的任何股息都進行了再投資),以及任何貼現融資和剝離的計算價值。因此,對於支付豐厚股息的公司來說,TSR往往比股價回報高得多。我們注意到Artisan Partners Asset Management過去1年的TSR為-1.5%,好於上面提到的股價回報率。該公司支付的股息因此提振了總計股東回報。
不同的視角
儘管Artisan Partners Asset Management在過去12個月中虧損1.5%令人痛苦,但大盤實際上更糟糕,回報率為8.1%。當然,長期回報要重要得多,好消息是,在過去的五年裡,該股的年回報率為12%。在最好的情況下,去年只是通向更光明未來的旅途中的一個暫時的轉捩點。我發現,把股價作為衡量企業業績的長期指標是非常有趣的。但為了真正獲得洞察力,我們還需要考慮其他資訊。例如,我們發現Artisan Partners Asset Management的2個警告信號(1有點令人擔憂!)在這裡投資之前你應該意識到這一點。
如果你更願意看看另一家公司--一家財務狀況可能更好的公司--那麼不要錯過這一點免費已證明自己能夠實現盈利增長的公司名單。
請注意,本文引用的市場回報反映了目前在美國交易所交易的股票的市場加權平均回報。
對這篇文章有什麼反饋嗎?擔心內容嗎?保持聯繫直接與我們聯繫。或者,也可以給編輯組發電子郵件,地址是implywallst.com。
本文由Simply Wall St.撰寫,具有概括性。我們僅使用不偏不倚的方法提供基於歷史數據和分析師預測的評論,我們的文章並不打算作為財務建議。它不構成買賣任何股票的建議,也沒有考慮你的目標或你的財務狀況。我們的目標是為您帶來由基本面數據驅動的長期重點分析。請注意,我們的分析可能不會將最新的對價格敏感的公司公告或定性材料考慮在內。Simply Wall St.對上述任何一隻股票都沒有持倉。
moomoo是Moomoo Technologies Inc.公司提供的金融資訊和交易應用程式。
在美國,moomoo上的投資產品和服務由Moomoo Financial Inc.提供,一家受美國證券交易委員會(SEC)監管的持牌主體。 Moomoo Financial Inc.是金融業監管局(FINRA)和證券投資者保護公司(SIPC)的成員。
在新加坡,moomoo上的投資產品和服務是通過Moomoo Financial Singapore Pte. Ltd.提供,該公司受新加坡金融管理局(MAS)監管(牌照號碼︰CMS101000) ,持有資本市場服務牌照 (CMS) ,持有財務顧問豁免(Exempt Financial Adviser)資質。本內容未經新加坡金融管理局的審查。
在澳大利亞,moomoo上的金融產品和服務是通過Futu Securities (Australia) Ltd提供,該公司是受澳大利亞證券和投資委員會(ASIC)監管的澳大利亞金融服務許可機構(AFSL No. 224663)。請閱讀並理解我們的《金融服務指南》、《條款與條件》、《隱私政策》和其他披露文件,這些文件可在我們的網站 https://www.moomoo.com/au中獲取。
在加拿大,透過moomoo應用程式提供的僅限訂單執行的券商服務由Moomoo Financial Canada Inc.提供,並受加拿大投資監管機構(CIRO)監管。
在馬來西亞,moomoo上的投資產品和服務是透過Moomoo Securities Malaysia Sdn. Bhd. 提供,該公司受馬來西亞證券監督委員會(SC)監管(牌照號碼︰eCMSL/A0397/2024) ,持有資本市場服務牌照 (CMSL) 。本內容未經馬來西亞證券監督委員會的審查。
Moomoo Technologies Inc., Moomoo Financial Inc., Moomoo Financial Singapore Pte. Ltd.,Futu Securities (Australia) Ltd, Moomoo Financial Canada Inc和Moomoo Securities Malaysia Sdn. Bhd., 是關聯公司。
風險及免責聲明
moomoo是Moomoo Technologies Inc.公司提供的金融資訊和交易應用程式。
在美國,moomoo上的投資產品和服務由Moomoo Financial Inc.提供,一家受美國證券交易委員會(SEC)監管的持牌主體。 Moomoo Financial Inc.是金融業監管局(FINRA)和證券投資者保護公司(SIPC)的成員。
在新加坡,moomoo上的投資產品和服務是通過Moomoo Financial Singapore Pte. Ltd.提供,該公司受新加坡金融管理局(MAS)監管(牌照號碼︰CMS101000) ,持有資本市場服務牌照 (CMS) ,持有財務顧問豁免(Exempt Financial Adviser)資質。本內容未經新加坡金融管理局的審查。
在澳大利亞,moomoo上的金融產品和服務是通過Futu Securities (Australia) Ltd提供,該公司是受澳大利亞證券和投資委員會(ASIC)監管的澳大利亞金融服務許可機構(AFSL No. 224663)。請閱讀並理解我們的《金融服務指南》、《條款與條件》、《隱私政策》和其他披露文件,這些文件可在我們的網站 https://www.moomoo.com/au中獲取。
在加拿大,透過moomoo應用程式提供的僅限訂單執行的券商服務由Moomoo Financial Canada Inc.提供,並受加拿大投資監管機構(CIRO)監管。
在馬來西亞,moomoo上的投資產品和服務是透過Moomoo Securities Malaysia Sdn. Bhd. 提供,該公司受馬來西亞證券監督委員會(SC)監管(牌照號碼︰eCMSL/A0397/2024) ,持有資本市場服務牌照 (CMSL) 。本內容未經馬來西亞證券監督委員會的審查。
Moomoo Technologies Inc., Moomoo Financial Inc., Moomoo Financial Singapore Pte. Ltd.,Futu Securities (Australia) Ltd, Moomoo Financial Canada Inc和Moomoo Securities Malaysia Sdn. Bhd., 是關聯公司。
- 分享到weixin
- 分享到qq
- 分享到facebook
- 分享到twitter
- 分享到微博
- 粘贴板
使用瀏覽器的分享功能,分享給你的好友吧