
-
市場
-
產品
-
資訊
-
Moo社區
-
課堂
-
查看更多
-
功能介紹
-
費用費用透明,無最低余額限制
投資選擇、功能介紹、費用相關信息由Moomoo Financial Inc.提供
- English
- 中文繁體
- 中文简体
- 深色
- 淺色
Investors in Dongfeng Motor Group (HKG:489) Have Unfortunately Lost 39% Over the Last Five Years
Investors in Dongfeng Motor Group (HKG:489) Have Unfortunately Lost 39% Over the Last Five Years
Dongfeng Motor Group Company Limited (HKG:489) shareholders should be happy to see the share price up 27% in the last quarter. But if you look at the last five years the returns have not been good. You would have done a lot better buying an index fund, since the stock has dropped 55% in that half decade.
With that in mind, it's worth seeing if the company's underlying fundamentals have been the driver of long term performance, or if there are some discrepancies.
See our latest analysis for Dongfeng Motor Group
While markets are a powerful pricing mechanism, share prices reflect investor sentiment, not just underlying business performance. One way to examine how market sentiment has changed over time is to look at the interaction between a company's share price and its earnings per share (EPS).
During the five years over which the share price declined, Dongfeng Motor Group's earnings per share (EPS) dropped by 9.4% each year. Readers should note that the share price has fallen faster than the EPS, at a rate of 15% per year, over the period. This implies that the market was previously too optimistic about the stock. The less favorable sentiment is reflected in its current P/E ratio of 4.21.
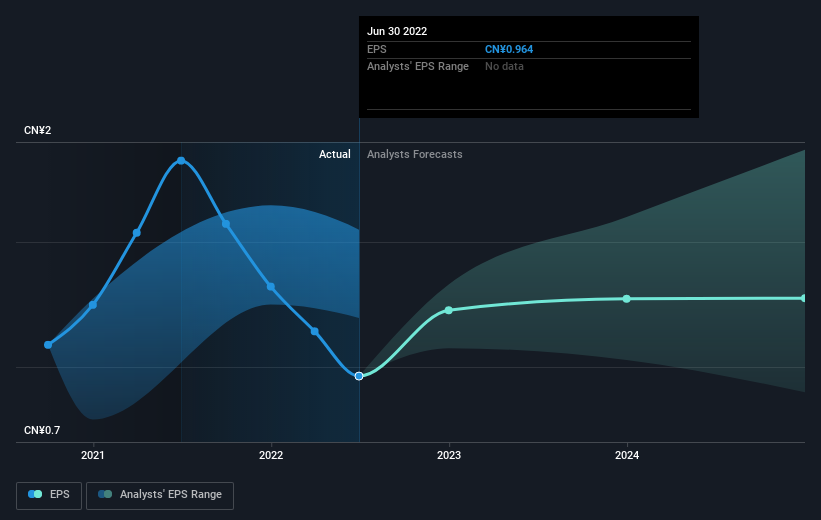
The graphic below depicts how EPS has changed over time (unveil the exact values by clicking on the image).
We're pleased to report that the CEO is remunerated more modestly than most CEOs at similarly capitalized companies. It's always worth keeping an eye on CEO pay, but a more important question is whether the company will grow earnings throughout the years. Before buying or selling a stock, we always recommend a close examination of historic growth trends, available here..
What About Dividends?
When looking at investment returns, it is important to consider the difference between total shareholder return (TSR) and share price return. The TSR incorporates the value of any spin-offs or discounted capital raisings, along with any dividends, based on the assumption that the dividends are reinvested. So for companies that pay a generous dividend, the TSR is often a lot higher than the share price return. As it happens, Dongfeng Motor Group's TSR for the last 5 years was -39%, which exceeds the share price return mentioned earlier. And there's no prize for guessing that the dividend payments largely explain the divergence!
A Different Perspective
We regret to report that Dongfeng Motor Group shareholders are down 32% for the year (even including dividends). Unfortunately, that's worse than the broader market decline of 9.0%. However, it could simply be that the share price has been impacted by broader market jitters. It might be worth keeping an eye on the fundamentals, in case there's a good opportunity. Unfortunately, last year's performance may indicate unresolved challenges, given that it was worse than the annualised loss of 7% over the last half decade. We realise that Baron Rothschild has said investors should "buy when there is blood on the streets", but we caution that investors should first be sure they are buying a high quality business. I find it very interesting to look at share price over the long term as a proxy for business performance. But to truly gain insight, we need to consider other information, too. Even so, be aware that Dongfeng Motor Group is showing 1 warning sign in our investment analysis , you should know about...
We will like Dongfeng Motor Group better if we see some big insider buys. While we wait, check out this free list of growing companies with considerable, recent, insider buying.
Please note, the market returns quoted in this article reflect the market weighted average returns of stocks that currently trade on HK exchanges.
Have feedback on this article? Concerned about the content? Get in touch with us directly. Alternatively, email editorial-team (at) simplywallst.com.
This article by Simply Wall St is general in nature. We provide commentary based on historical data and analyst forecasts only using an unbiased methodology and our articles are not intended to be financial advice. It does not constitute a recommendation to buy or sell any stock, and does not take account of your objectives, or your financial situation. We aim to bring you long-term focused analysis driven by fundamental data. Note that our analysis may not factor in the latest price-sensitive company announcements or qualitative material. Simply Wall St has no position in any stocks mentioned.
東風集團股份股份有限公司(HKG:489)股東應該樂於看到股價在最後一個季度上漲27%。但如果你看看過去五年,你會發現回報並不好。購買指數基金會好得多,因為指數基金的股價在這五年裡下跌了55%。
考慮到這一點,值得關注的是,該公司的潛在基本面是長期業績的驅動力,還是存在一些差異。
參見我們對東風集團股份的最新分析
雖然市場是一種強大的定價機制,但股價反映的是投資者情緒,而不僅僅是潛在的企業表現。考察市場情緒如何隨時間變化的一種方法是觀察一家公司的股價和每股收益(EPS)之間的相互作用。
在股價下跌的五年裡,東風集團股份的每股收益(EPS)每年下降9.4%。讀者應該注意到,在此期間,該公司股價以每年15%的速度下跌,速度比每股收益更快。這暗示市場此前對該股過於樂觀。這種不那麼有利的情緒反映在其目前4.21的本益比上。
下圖描述了EPS是如何隨著時間的推移而變化的(通過單擊圖像來揭示確切的值)。
我們很高興地報告,這位首席執行官的薪酬比類似資本公司的大多數首席執行官都要低。關注首席執行官的薪酬總是值得的,但更重要的問題是,該公司是否會在未來幾年實現盈利增長。在買賣股票之前,我們總是建議仔細檢查一下歷史增長趨勢,可在此處找到。
那股息呢?
在考察投資回報時,重要的是要考慮到股東總回報(TSR)和股價回報。TSR包括任何剝離或貼現融資的價值,以及任何股息,基於股息再投資的假設。因此,對於支付豐厚股息的公司來說,TSR往往比股價回報高得多。碰巧,東風集團股份最近5年的TSR為-39%,超過了前面提到的股價回報。而且,猜測股息支付在很大程度上解釋了這種差異是沒有好處的!
不同的視角
我們遺憾地報告,東風集團股份的股東今年以來下跌了32%(即使包括股息)。不幸的是,這比大盤9.0%的跌幅還要糟糕。然而,這可能只是因為股價受到了更廣泛的市場緊張情緒的影響。也許有必要關注基本面,以防出現良機。不幸的是,去年的表現可能預示著尚未解決的挑戰,因為它比過去五年7%的年化損失更糟糕。我們意識到,羅斯柴爾德男爵曾說過,投資者應該“在街上血淋淋的時候買入”,但我們警告投資者,首先應該確保他們購買的是一家高質量的企業。我發現,把股價作為衡量企業業績的長期指標是非常有趣的。但為了真正獲得洞察力,我們還需要考慮其他資訊。即便如此,要知道東風集團股份正在展示在我們的投資分析中出現1個警告信號,你應該知道關於……
如果我們看到一些大的內部收購,我們會更喜歡東風集團股份。在我們等待的時候,看看這個免費最近有大量內幕收購的成長型公司名單。
請注意,本文引用的市場回報反映了目前在香港交易所交易的股票的市場加權平均回報。
對這篇文章有什麼反饋嗎?擔心內容嗎?保持聯繫直接與我們聯繫。或者,也可以給編輯組發電子郵件,地址是implywallst.com。
本文由Simply Wall St.撰寫,具有概括性。我們僅使用不偏不倚的方法提供基於歷史數據和分析師預測的評論,我們的文章並不打算作為財務建議。它不構成買賣任何股票的建議,也沒有考慮你的目標或你的財務狀況。我們的目標是為您帶來由基本面數據驅動的長期重點分析。請注意,我們的分析可能不會將最新的對價格敏感的公司公告或定性材料考慮在內。Simply Wall St.對上述任何一隻股票都沒有持倉。
moomoo是Moomoo Technologies Inc.公司提供的金融資訊和交易應用程式。
在美國,moomoo上的投資產品和服務由Moomoo Financial Inc.提供,一家受美國證券交易委員會(SEC)監管的持牌主體。 Moomoo Financial Inc.是金融業監管局(FINRA)和證券投資者保護公司(SIPC)的成員。
在新加坡,moomoo上的投資產品和服務是通過Moomoo Financial Singapore Pte. Ltd.提供,該公司受新加坡金融管理局(MAS)監管(牌照號碼︰CMS101000) ,持有資本市場服務牌照 (CMS) ,持有財務顧問豁免(Exempt Financial Adviser)資質。本內容未經新加坡金融管理局的審查。
在澳大利亞,moomoo上的金融產品和服務是通過Futu Securities (Australia) Ltd提供,該公司是受澳大利亞證券和投資委員會(ASIC)監管的澳大利亞金融服務許可機構(AFSL No. 224663)。請閱讀並理解我們的《金融服務指南》、《條款與條件》、《隱私政策》和其他披露文件,這些文件可在我們的網站 https://www.moomoo.com/au中獲取。
在加拿大,透過moomoo應用程式提供的僅限訂單執行的券商服務由Moomoo Financial Canada Inc.提供,並受加拿大投資監管機構(CIRO)監管。
在馬來西亞,moomoo上的投資產品和服務是透過Moomoo Securities Malaysia Sdn. Bhd. 提供,該公司受馬來西亞證券監督委員會(SC)監管(牌照號碼︰eCMSL/A0397/2024) ,持有資本市場服務牌照 (CMSL) 。本內容未經馬來西亞證券監督委員會的審查。
Moomoo Technologies Inc., Moomoo Financial Inc., Moomoo Financial Singapore Pte. Ltd.,Futu Securities (Australia) Ltd, Moomoo Financial Canada Inc和Moomoo Securities Malaysia Sdn. Bhd., 是關聯公司。
風險及免責聲明
moomoo是Moomoo Technologies Inc.公司提供的金融資訊和交易應用程式。
在美國,moomoo上的投資產品和服務由Moomoo Financial Inc.提供,一家受美國證券交易委員會(SEC)監管的持牌主體。 Moomoo Financial Inc.是金融業監管局(FINRA)和證券投資者保護公司(SIPC)的成員。
在新加坡,moomoo上的投資產品和服務是通過Moomoo Financial Singapore Pte. Ltd.提供,該公司受新加坡金融管理局(MAS)監管(牌照號碼︰CMS101000) ,持有資本市場服務牌照 (CMS) ,持有財務顧問豁免(Exempt Financial Adviser)資質。本內容未經新加坡金融管理局的審查。
在澳大利亞,moomoo上的金融產品和服務是通過Futu Securities (Australia) Ltd提供,該公司是受澳大利亞證券和投資委員會(ASIC)監管的澳大利亞金融服務許可機構(AFSL No. 224663)。請閱讀並理解我們的《金融服務指南》、《條款與條件》、《隱私政策》和其他披露文件,這些文件可在我們的網站 https://www.moomoo.com/au中獲取。
在加拿大,透過moomoo應用程式提供的僅限訂單執行的券商服務由Moomoo Financial Canada Inc.提供,並受加拿大投資監管機構(CIRO)監管。
在馬來西亞,moomoo上的投資產品和服務是透過Moomoo Securities Malaysia Sdn. Bhd. 提供,該公司受馬來西亞證券監督委員會(SC)監管(牌照號碼︰eCMSL/A0397/2024) ,持有資本市場服務牌照 (CMSL) 。本內容未經馬來西亞證券監督委員會的審查。
Moomoo Technologies Inc., Moomoo Financial Inc., Moomoo Financial Singapore Pte. Ltd.,Futu Securities (Australia) Ltd, Moomoo Financial Canada Inc和Moomoo Securities Malaysia Sdn. Bhd., 是關聯公司。
- 分享到weixin
- 分享到qq
- 分享到facebook
- 分享到twitter
- 分享到微博
- 粘贴板
使用瀏覽器的分享功能,分享給你的好友吧