
-
市場
-
產品
-
資訊
-
Moo社區
-
課堂
-
查看更多
-
功能介紹
-
費用費用透明,無最低余額限制
投資選擇、功能介紹、費用相關信息由Moomoo Financial Inc.提供
- English
- 中文繁體
- 中文简体
- 深色
- 淺色
BOE Varitronix (HKG:710) Stock Performs Better Than Its Underlying Earnings Growth Over Last Three Years
BOE Varitronix (HKG:710) Stock Performs Better Than Its Underlying Earnings Growth Over Last Three Years
For us, stock picking is in large part the hunt for the truly magnificent stocks. You won't get it right every time, but when you do, the returns can be truly splendid. Take, for example, the BOE Varitronix Limited (HKG:710) share price, which skyrocketed 575% over three years. It's also good to see the share price up 25% over the last quarter. But this move may well have been assisted by the reasonably buoyant market (up 23% in 90 days). It really delights us to see such great share price performance for investors.
The past week has proven to be lucrative for BOE Varitronix investors, so let's see if fundamentals drove the company's three-year performance.
View our latest analysis for BOE Varitronix
There is no denying that markets are sometimes efficient, but prices do not always reflect underlying business performance. One way to examine how market sentiment has changed over time is to look at the interaction between a company's share price and its earnings per share (EPS).
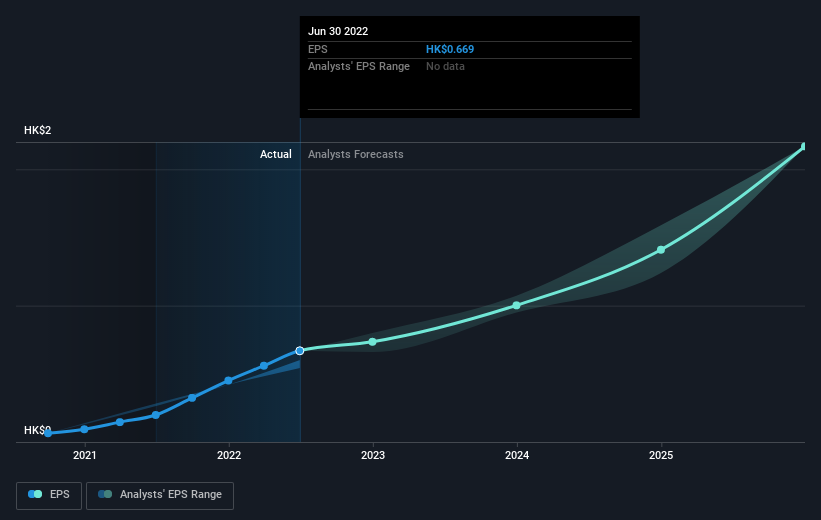
BOE Varitronix was able to grow its EPS at 218% per year over three years, sending the share price higher. The average annual share price increase of 89% is actually lower than the EPS growth. So one could reasonably conclude that the market has cooled on the stock.
The company's earnings per share (over time) is depicted in the image below (click to see the exact numbers).
It is of course excellent to see how BOE Varitronix has grown profits over the years, but the future is more important for shareholders. You can see how its balance sheet has strengthened (or weakened) over time in this free interactive graphic.
What About Dividends?
It is important to consider the total shareholder return, as well as the share price return, for any given stock. Whereas the share price return only reflects the change in the share price, the TSR includes the value of dividends (assuming they were reinvested) and the benefit of any discounted capital raising or spin-off. Arguably, the TSR gives a more comprehensive picture of the return generated by a stock. We note that for BOE Varitronix the TSR over the last 3 years was 666%, which is better than the share price return mentioned above. And there's no prize for guessing that the dividend payments largely explain the divergence!
A Different Perspective
It's good to see that BOE Varitronix has rewarded shareholders with a total shareholder return of 68% in the last twelve months. And that does include the dividend. Since the one-year TSR is better than the five-year TSR (the latter coming in at 30% per year), it would seem that the stock's performance has improved in recent times. Someone with an optimistic perspective could view the recent improvement in TSR as indicating that the business itself is getting better with time. While it is well worth considering the different impacts that market conditions can have on the share price, there are other factors that are even more important. To that end, you should be aware of the 2 warning signs we've spotted with BOE Varitronix .
If you would prefer to check out another company -- one with potentially superior financials -- then do not miss this free list of companies that have proven they can grow earnings.
Please note, the market returns quoted in this article reflect the market weighted average returns of stocks that currently trade on HK exchanges.
Have feedback on this article? Concerned about the content? Get in touch with us directly. Alternatively, email editorial-team (at) simplywallst.com.
This article by Simply Wall St is general in nature. We provide commentary based on historical data and analyst forecasts only using an unbiased methodology and our articles are not intended to be financial advice. It does not constitute a recommendation to buy or sell any stock, and does not take account of your objectives, or your financial situation. We aim to bring you long-term focused analysis driven by fundamental data. Note that our analysis may not factor in the latest price-sensitive company announcements or qualitative material. Simply Wall St has no position in any stocks mentioned.
對我們來說,選股在很大程度上是為了尋找真正輝煌的股票。你不會每次都做對,但當你做對了,回報可能真的會非常豐厚。舉個例子,京東方華立電子有限公司(HKG:710)股價在三年內飆升575%。上個季度股價上漲了25%,這也是件好事。但這一舉措很可能得到了相當活躍的市場的幫助(90天內上漲了23%)。看到投資者的股價表現如此出色,我們真的很高興。
事實證明,過去一週對京東方Varitronix的投資者來說利潤豐厚,所以讓我們看看基本面因素是否推動了該公司三年的業績。
查看我們對京東方Varitronix的最新分析
不可否認,市場有時是有效的,但價格並不總是反映潛在的商業表現。考察市場情緒如何隨時間變化的一種方法是觀察一家公司的股價和每股收益(EPS)之間的相互作用。
英國央行Varitronix能夠在三年內以每年218%的速度增長每股收益,推動其股價走高。平均每年89%的股價漲幅實際上低於每股收益的增長。因此,人們可以合理地得出結論,市場對該股的態度已經降溫。
該公司的每股收益(在一段時間內)如下圖所示(點擊查看具體數位)。
看到京東方Varitronix多年來如何實現利潤增長當然很棒,但對股東來說,未來更重要。你可以看到它的資產負債表是如何隨著時間的推移而加強(或削弱)的免費互動式圖形。
那股息呢?
重要的是要考慮任何給定股票的總股東回報以及股價回報。雖然股價回報只反映股價的變動,但TSR包括股息的價值(假設股息再投資),以及任何折價集資或分拆所帶來的利益。可以說,TSR更全面地描繪了一隻股票產生的回報。我們注意到,京東方Varitronix過去3年的總回報率為666%,好於上述股價回報率。而且,猜測股息支付在很大程度上解釋了這種差異是沒有好處的!
不同的視角
很高興看到京東方Varitronix在過去12個月裡為股東帶來了68%的總回報。這確實包括了股息。由於一年期的TSR好於五年期的TSR(後者的年收益率為30%),看起來該股的表現在最近有所改善。持樂觀觀點的人可能會認為,最近TSR的改善表明,業務本身正在隨著時間的推移而變得更好。雖然值得考慮市場狀況對股價可能產生的不同影響,但還有其他更重要的因素。為此,您應該意識到2個警告標誌我們發現了京東方Varitronix。
如果你更願意看看另一家公司--一家財務狀況可能更好的公司--那麼不要錯過這一點免費已證明自己能夠實現盈利增長的公司名單。
請注意,本文引用的市場回報反映了目前在香港交易所交易的股票的市場加權平均回報。
對這篇文章有什麼反饋嗎?擔心內容嗎?保持聯繫直接與我們聯繫。或者,也可以給編輯組發電子郵件,地址是implywallst.com。
本文由Simply Wall St.撰寫,具有概括性。我們僅使用不偏不倚的方法提供基於歷史數據和分析師預測的評論,我們的文章並不打算作為財務建議。它不構成買賣任何股票的建議,也沒有考慮你的目標或你的財務狀況。我們的目標是為您帶來由基本面數據驅動的長期重點分析。請注意,我們的分析可能不會將最新的對價格敏感的公司公告或定性材料考慮在內。Simply Wall St.對上述任何一隻股票都沒有持倉。
moomoo是Moomoo Technologies Inc.公司提供的金融資訊和交易應用程式。
在美國,moomoo上的投資產品和服務由Moomoo Financial Inc.提供,一家受美國證券交易委員會(SEC)監管的持牌主體。 Moomoo Financial Inc.是金融業監管局(FINRA)和證券投資者保護公司(SIPC)的成員。
在新加坡,moomoo上的投資產品和服務是通過Moomoo Financial Singapore Pte. Ltd.提供,該公司受新加坡金融管理局(MAS)監管(牌照號碼︰CMS101000) ,持有資本市場服務牌照 (CMS) ,持有財務顧問豁免(Exempt Financial Adviser)資質。本內容未經新加坡金融管理局的審查。
在澳大利亞,moomoo上的金融產品和服務是通過Futu Securities (Australia) Ltd提供,該公司是受澳大利亞證券和投資委員會(ASIC)監管的澳大利亞金融服務許可機構(AFSL No. 224663)。請閱讀並理解我們的《金融服務指南》、《條款與條件》、《隱私政策》和其他披露文件,這些文件可在我們的網站 https://www.moomoo.com/au中獲取。
在加拿大,透過moomoo應用程式提供的僅限訂單執行的券商服務由Moomoo Financial Canada Inc.提供,並受加拿大投資監管機構(CIRO)監管。
在馬來西亞,moomoo上的投資產品和服務是透過Moomoo Securities Malaysia Sdn. Bhd. 提供,該公司受馬來西亞證券監督委員會(SC)監管(牌照號碼︰eCMSL/A0397/2024) ,持有資本市場服務牌照 (CMSL) 。本內容未經馬來西亞證券監督委員會的審查。
Moomoo Technologies Inc., Moomoo Financial Inc., Moomoo Financial Singapore Pte. Ltd.,Futu Securities (Australia) Ltd, Moomoo Financial Canada Inc和Moomoo Securities Malaysia Sdn. Bhd., 是關聯公司。
風險及免責聲明
moomoo是Moomoo Technologies Inc.公司提供的金融資訊和交易應用程式。
在美國,moomoo上的投資產品和服務由Moomoo Financial Inc.提供,一家受美國證券交易委員會(SEC)監管的持牌主體。 Moomoo Financial Inc.是金融業監管局(FINRA)和證券投資者保護公司(SIPC)的成員。
在新加坡,moomoo上的投資產品和服務是通過Moomoo Financial Singapore Pte. Ltd.提供,該公司受新加坡金融管理局(MAS)監管(牌照號碼︰CMS101000) ,持有資本市場服務牌照 (CMS) ,持有財務顧問豁免(Exempt Financial Adviser)資質。本內容未經新加坡金融管理局的審查。
在澳大利亞,moomoo上的金融產品和服務是通過Futu Securities (Australia) Ltd提供,該公司是受澳大利亞證券和投資委員會(ASIC)監管的澳大利亞金融服務許可機構(AFSL No. 224663)。請閱讀並理解我們的《金融服務指南》、《條款與條件》、《隱私政策》和其他披露文件,這些文件可在我們的網站 https://www.moomoo.com/au中獲取。
在加拿大,透過moomoo應用程式提供的僅限訂單執行的券商服務由Moomoo Financial Canada Inc.提供,並受加拿大投資監管機構(CIRO)監管。
在馬來西亞,moomoo上的投資產品和服務是透過Moomoo Securities Malaysia Sdn. Bhd. 提供,該公司受馬來西亞證券監督委員會(SC)監管(牌照號碼︰eCMSL/A0397/2024) ,持有資本市場服務牌照 (CMSL) 。本內容未經馬來西亞證券監督委員會的審查。
Moomoo Technologies Inc., Moomoo Financial Inc., Moomoo Financial Singapore Pte. Ltd.,Futu Securities (Australia) Ltd, Moomoo Financial Canada Inc和Moomoo Securities Malaysia Sdn. Bhd., 是關聯公司。
- 分享到weixin
- 分享到qq
- 分享到facebook
- 分享到twitter
- 分享到微博
- 粘贴板
使用瀏覽器的分享功能,分享給你的好友吧