
-
市場
-
產品
-
資訊
-
Moo社區
-
課堂
-
查看更多
-
功能介紹
-
費用費用透明,無最低余額限制
投資選擇、功能介紹、費用相關信息由Moomoo Financial Inc.提供
- English
- 中文繁體
- 中文简体
- 深色
- 淺色
The Returns On Capital At Tianli International Holdings (HKG:1773) Don't Inspire Confidence
The Returns On Capital At Tianli International Holdings (HKG:1773) Don't Inspire Confidence
Did you know there are some financial metrics that can provide clues of a potential multi-bagger? Typically, we'll want to notice a trend of growing return on capital employed (ROCE) and alongside that, an expanding base of capital employed. Basically this means that a company has profitable initiatives that it can continue to reinvest in, which is a trait of a compounding machine. However, after briefly looking over the numbers, we don't think Tianli International Holdings (HKG:1773) has the makings of a multi-bagger going forward, but let's have a look at why that may be.
Return On Capital Employed (ROCE): What Is It?
For those that aren't sure what ROCE is, it measures the amount of pre-tax profits a company can generate from the capital employed in its business. The formula for this calculation on Tianli International Holdings is:
Return on Capital Employed = Earnings Before Interest and Tax (EBIT) ÷ (Total Assets - Current Liabilities)
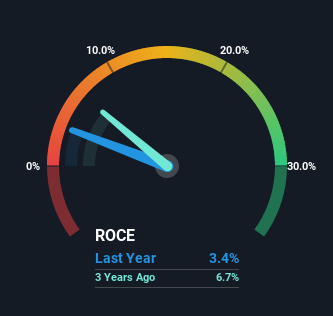
0.034 = CN¥149m ÷ (CN¥8.1b - CN¥3.8b) (Based on the trailing twelve months to August 2022).
Thus, Tianli International Holdings has an ROCE of 3.4%. In absolute terms, that's a low return and it also under-performs the Consumer Services industry average of 8.7%.
Check out our latest analysis for Tianli International Holdings
Above you can see how the current ROCE for Tianli International Holdings compares to its prior returns on capital, but there's only so much you can tell from the past. If you'd like, you can check out the forecasts from the analysts covering Tianli International Holdings here for free.
What Can We Tell From Tianli International Holdings' ROCE Trend?
When we looked at the ROCE trend at Tianli International Holdings, we didn't gain much confidence. Over the last five years, returns on capital have decreased to 3.4% from 8.4% five years ago. Although, given both revenue and the amount of assets employed in the business have increased, it could suggest the company is investing in growth, and the extra capital has led to a short-term reduction in ROCE. And if the increased capital generates additional returns, the business, and thus shareholders, will benefit in the long run.
On a separate but related note, it's important to know that Tianli International Holdings has a current liabilities to total assets ratio of 47%, which we'd consider pretty high. This can bring about some risks because the company is basically operating with a rather large reliance on its suppliers or other sorts of short-term creditors. While it's not necessarily a bad thing, it can be beneficial if this ratio is lower.
The Bottom Line On Tianli International Holdings' ROCE
While returns have fallen for Tianli International Holdings in recent times, we're encouraged to see that sales are growing and that the business is reinvesting in its operations. These growth trends haven't led to growth returns though, since the stock has fallen 18% over the last three years. As a result, we'd recommend researching this stock further to uncover what other fundamentals of the business can show us.
If you'd like to know about the risks facing Tianli International Holdings, we've discovered 2 warning signs that you should be aware of.
While Tianli International Holdings isn't earning the highest return, check out this free list of companies that are earning high returns on equity with solid balance sheets.
Have feedback on this article? Concerned about the content? Get in touch with us directly. Alternatively, email editorial-team (at) simplywallst.com.
This article by Simply Wall St is general in nature. We provide commentary based on historical data and analyst forecasts only using an unbiased methodology and our articles are not intended to be financial advice. It does not constitute a recommendation to buy or sell any stock, and does not take account of your objectives, or your financial situation. We aim to bring you long-term focused analysis driven by fundamental data. Note that our analysis may not factor in the latest price-sensitive company announcements or qualitative material. Simply Wall St has no position in any stocks mentioned.
你知道嗎,有一些財務指標可以提供潛在的多管齊下的線索?通常,我們會注意到一種增長的趨勢退貨關於已使用資本(ROCE)以及與之相伴隨的是不斷擴大的基地已動用資本的比例。基本上,這意味著一家公司有盈利的舉措,可以繼續進行再投資,這是復合機器的一個特點。然而,在簡單地看了一下數位之後,我們認為天利國際控股有限公司(HKG:1773)具備了未來實現多個袋子的條件,但讓我們看看為什麼會這樣。
資本回報率(ROCE):它是什麼?
對於那些不確定ROCE是什麼的人,它衡量的是一家公司可以從其業務中使用的資本產生的稅前利潤。天利國際控股的這一計算公式為:
已動用資本回報率=息稅前收益(EBIT)?(總資產-流動負債)
0.034=人民幣1.49億?(人民幣81億元-人民幣38億元)(根據截至2022年8月的過去12個月計算)。
因此,天利國際控股的淨資產收益率為3.4%。按絕對值計算,這是一個較低的回報率,也低於消費者服務行業8.7%的平均水準。
查看我們對天利國際控股的最新分析
上面你可以看到天利國際控股公司目前的淨資產收益率與之前的資本回報率相比如何,但你只能從過去知道這麼多。如果你願意,你可以在這裡查看天利國際控股分析師的預測。免費的。
從天利國際控股的ROCE趨勢中,我們可以看出什麼?
當我們觀察天利國際控股的ROCE走勢時,我們並沒有獲得太多信心。過去五年,資本回報率從五年前的8.4%降至3.4%。儘管,考慮到收入和業務中使用的資產數量都有所增加,這可能表明該公司正在投資於增長,而額外的資本導致了ROCE的短期下降。如果增加的資本產生額外的回報,從長遠來看,企業和股東都將受益。
另外一個相關的問題是,天利國際控股有限公司的流動負債與總資產之比為47%,我們認為這個比率相當高,這一點很重要。這可能會帶來一些風險,因為該公司基本上是在相當大程度上依賴其供應商或其他類型的短期債權人運營的。雖然這不一定是一件壞事,但如果這一比例較低,它可能是有益的。
天利國際控股公司ROCE的底線
雖然近期天利國際控股的回報率有所下降,但我們看到銷售額在增長,而且正在對業務進行再投資,這讓我們感到鼓舞。不過,這些增長趨勢並沒有帶來增長回報,因為該公司股價在過去三年裡下跌了18%。因此,我們建議進一步研究這只股票,以揭示該業務的其他基本面可以向我們展示什麼。
如果您想了解天利國際控股面臨的風險,我們發現2個警告標誌這一點你應該知道。
雖然天利國際控股並沒有獲得最高的回報,但看看這個免費資產負債表穩健、股本回報率高的公司名單。
對這篇文章有什麼反饋嗎?擔心內容嗎?保持聯繫直接與我們聯繫。或者,也可以給編輯組發電子郵件,地址是implywallst.com。
本文由Simply Wall St.撰寫,具有概括性。我們僅使用不偏不倚的方法提供基於歷史數據和分析師預測的評論,我們的文章並不打算作為財務建議。它不構成買賣任何股票的建議,也沒有考慮你的目標或你的財務狀況。我們的目標是為您帶來由基本面數據驅動的長期重點分析。請注意,我們的分析可能不會將最新的對價格敏感的公司公告或定性材料考慮在內。Simply Wall St.對上述任何一隻股票都沒有持倉。
moomoo是Moomoo Technologies Inc.公司提供的金融資訊和交易應用程式。
在美國,moomoo上的投資產品和服務由Moomoo Financial Inc.提供,一家受美國證券交易委員會(SEC)監管的持牌主體。 Moomoo Financial Inc.是金融業監管局(FINRA)和證券投資者保護公司(SIPC)的成員。
在新加坡,moomoo上的投資產品和服務是通過Moomoo Financial Singapore Pte. Ltd.提供,該公司受新加坡金融管理局(MAS)監管(牌照號碼︰CMS101000) ,持有資本市場服務牌照 (CMS) ,持有財務顧問豁免(Exempt Financial Adviser)資質。本內容未經新加坡金融管理局的審查。
在澳大利亞,moomoo上的金融產品和服務是通過Futu Securities (Australia) Ltd提供,該公司是受澳大利亞證券和投資委員會(ASIC)監管的澳大利亞金融服務許可機構(AFSL No. 224663)。請閱讀並理解我們的《金融服務指南》、《條款與條件》、《隱私政策》和其他披露文件,這些文件可在我們的網站 https://www.moomoo.com/au中獲取。
在加拿大,透過moomoo應用程式提供的僅限訂單執行的券商服務由Moomoo Financial Canada Inc.提供,並受加拿大投資監管機構(CIRO)監管。
在馬來西亞,moomoo上的投資產品和服務是透過Moomoo Securities Malaysia Sdn. Bhd. 提供,該公司受馬來西亞證券監督委員會(SC)監管(牌照號碼︰eCMSL/A0397/2024) ,持有資本市場服務牌照 (CMSL) 。本內容未經馬來西亞證券監督委員會的審查。
Moomoo Technologies Inc., Moomoo Financial Inc., Moomoo Financial Singapore Pte. Ltd.,Futu Securities (Australia) Ltd, Moomoo Financial Canada Inc和Moomoo Securities Malaysia Sdn. Bhd., 是關聯公司。
風險及免責聲明
moomoo是Moomoo Technologies Inc.公司提供的金融資訊和交易應用程式。
在美國,moomoo上的投資產品和服務由Moomoo Financial Inc.提供,一家受美國證券交易委員會(SEC)監管的持牌主體。 Moomoo Financial Inc.是金融業監管局(FINRA)和證券投資者保護公司(SIPC)的成員。
在新加坡,moomoo上的投資產品和服務是通過Moomoo Financial Singapore Pte. Ltd.提供,該公司受新加坡金融管理局(MAS)監管(牌照號碼︰CMS101000) ,持有資本市場服務牌照 (CMS) ,持有財務顧問豁免(Exempt Financial Adviser)資質。本內容未經新加坡金融管理局的審查。
在澳大利亞,moomoo上的金融產品和服務是通過Futu Securities (Australia) Ltd提供,該公司是受澳大利亞證券和投資委員會(ASIC)監管的澳大利亞金融服務許可機構(AFSL No. 224663)。請閱讀並理解我們的《金融服務指南》、《條款與條件》、《隱私政策》和其他披露文件,這些文件可在我們的網站 https://www.moomoo.com/au中獲取。
在加拿大,透過moomoo應用程式提供的僅限訂單執行的券商服務由Moomoo Financial Canada Inc.提供,並受加拿大投資監管機構(CIRO)監管。
在馬來西亞,moomoo上的投資產品和服務是透過Moomoo Securities Malaysia Sdn. Bhd. 提供,該公司受馬來西亞證券監督委員會(SC)監管(牌照號碼︰eCMSL/A0397/2024) ,持有資本市場服務牌照 (CMSL) 。本內容未經馬來西亞證券監督委員會的審查。
Moomoo Technologies Inc., Moomoo Financial Inc., Moomoo Financial Singapore Pte. Ltd.,Futu Securities (Australia) Ltd, Moomoo Financial Canada Inc和Moomoo Securities Malaysia Sdn. Bhd., 是關聯公司。
- 分享到weixin
- 分享到qq
- 分享到facebook
- 分享到twitter
- 分享到微博
- 粘贴板
使用瀏覽器的分享功能,分享給你的好友吧