
-
市場
-
產品
-
資訊
-
Moo社區
-
課堂
-
查看更多
-
功能介紹
-
費用費用透明,無最低余額限制
投資選擇、功能介紹、費用相關信息由Moomoo Financial Inc.提供
- English
- 中文繁體
- 中文简体
- 深色
- 淺色
Tam Jai International Co. Limited (HKG:2217) Not Lagging Market On Growth Or Pricing
Tam Jai International Co. Limited (HKG:2217) Not Lagging Market On Growth Or Pricing
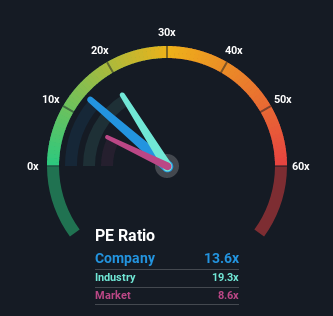
Tam Jai International Co. Limited's (HKG:2217) price-to-earnings (or "P/E") ratio of 13.6x might make it look like a strong sell right now compared to the market in Hong Kong, where around half of the companies have P/E ratios below 8x and even P/E's below 4x are quite common. However, the P/E might be quite high for a reason and it requires further investigation to determine if it's justified.
Recent times haven't been advantageous for Tam Jai International as its earnings have been falling quicker than most other companies. One possibility is that the P/E is high because investors think the company will turn things around completely and accelerate past most others in the market. If not, then existing shareholders may be very nervous about the viability of the share price.
Check out our latest analysis for Tam Jai International
 SEHK:2217 Price Based on Past Earnings September 28th 2022 Keen to find out how analysts think Tam Jai International's future stacks up against the industry? In that case, our free report is a great place to start.
 How Is Tam Jai International's Growth Trending?
There's an inherent assumption that a company should far outperform the market for P/E ratios like Tam Jai International's to be considered reasonable.
Taking a look back first, the company's earnings per share growth last year wasn't something to get excited about as it posted a disappointing decline of 39%. This means it has also seen a slide in earnings over the longer-term as EPS is down 23% in total over the last three years. Accordingly, shareholders would have felt downbeat about the medium-term rates of earnings growth.
Shifting to the future, estimates from the four analysts covering the company suggest earnings should grow by 33% per year over the next three years. That's shaping up to be materially higher than the 14% per year growth forecast for the broader market.
In light of this, it's understandable that Tam Jai International's P/E sits above the majority of other companies. It seems most investors are expecting this strong future growth and are willing to pay more for the stock.
The Key Takeaway
Using the price-to-earnings ratio alone to determine if you should sell your stock isn't sensible, however it can be a practical guide to the company's future prospects.
We've established that Tam Jai International maintains its high P/E on the strength of its forecast growth being higher than the wider market, as expected. At this stage investors feel the potential for a deterioration in earnings isn't great enough to justify a lower P/E ratio. It's hard to see the share price falling strongly in the near future under these circumstances.
And what about other risks? Every company has them, and we've spotted 3 warning signs for Tam Jai International you should know about.
Of course, you might find a fantastic investment by looking at a few good candidates. So take a peek at this free list of companies with a strong growth track record, trading on a P/E below 20x.
Have feedback on this article? Concerned about the content? Get in touch with us directly. Alternatively, email editorial-team (at) simplywallst.com.
This article by Simply Wall St is general in nature. We provide commentary based on historical data and analyst forecasts only using an unbiased methodology and our articles are not intended to be financial advice. It does not constitute a recommendation to buy or sell any stock, and does not take account of your objectives, or your financial situation. We aim to bring you long-term focused analysis driven by fundamental data. Note that our analysis may not factor in the latest price-sensitive company announcements or qualitative material. Simply Wall St has no position in any stocks mentioned.
Tam Jai 國際有限公司限量版 (HKG: 2217) 與香港市場相比,13.6倍的市盈率(或 “市盈率”)現在可能看起來像強勁的賣出,在香港市場,大約有一半的公司的市盈率低於8倍,甚至市盈率低於4倍也很常見。但是,市盈率可能很高是有原因的,需要進一步調查以確定其是否合理。
最近對Tam Jai International來說並不有利,因爲其收益下降速度快於大多數其他公司。一種可能性是市盈率很高,因爲投資者認爲該公司將徹底扭轉局面,超越市場上的大多數其他公司。如果沒有,那麼現有股東可能會對股價的可行性感到非常緊張。
查看我們對 Tam Jai International 的最新分析
SEHK: 2217 價格基於過去的收益 2022 年 9 月 28 日渴望了解分析師如何看待 Tam Jai International 的未來與該行業對比?在這種情況下,我們的 免費的 報告是一個不錯的起點。 Tam Jai International 的增長趨勢如何?
人們固有的假設是,如果像Tam Jai International這樣的市盈率被認爲是合理的,公司的表現應該遠遠超過市場。
首先回顧一下,該公司去年的每股收益增長並不令人興奮,因爲它公佈了令人失望的39%的跌幅。這意味着從長遠來看,它的收益也有所下滑,因爲在過去三年中,每股收益總共下降了23%。因此,股東們會對中期收益增長率感到悲觀。
展望未來,報道該公司的四位分析師的估計表明,未來三年收益將每年增長33%。這將大大高於整個市場預期的每年14%的增長。
有鑑於此,Tam Jai International的市盈率高於大多數其他公司是可以理解的。看來大多數投資者都期待未來的強勁增長,並願意爲該股支付更多費用。
關鍵要點
僅使用市盈率來確定是否應該出售股票是不明智的,但它可以作爲公司未來前景的實用指南。
我們已經確定,Tam Jai International維持其高市盈率,因爲其預測的增長將高於整個市場,正如預期的那樣。在現階段,投資者認爲,收益惡化的可能性還不足以證明降低市盈率是合理的。在這種情況下,很難看到股價在不久的將來會大幅下跌。
那其他風險呢?每家公司都有它們,我們已經發現了 Tam Jai International 有 3 個警告 你應該知道。
當然, 通過尋找一些優秀的候選人,你可能會發現一筆不錯的投資。 所以來看看這個 免費的 具有強勁增長記錄、市盈率低於20倍的公司名單。
對這篇文章有反饋嗎?擔心內容嗎? 取得聯繫 直接和我們在一起。 或者,給編輯團隊 (at) simplywallst.com 發送電子郵件。
Simply Wall St 的這篇文章本質上是籠統的。 我們僅使用公正的方法根據歷史數據和分析師的預測提供評論,我們的文章無意作爲財務建議。 它不構成買入或賣出任何股票的建議,也沒有考慮您的目標或財務狀況。我們的目標是爲您提供由基本面數據驅動的長期重點分析。請注意,我們的分析可能不考慮最新的價格敏感公司公告或定性材料。簡而言之,華爾街在上述任何股票中都沒有頭寸。
moomoo是Moomoo Technologies Inc.公司提供的金融資訊和交易應用程式。
在美國,moomoo上的投資產品和服務由Moomoo Financial Inc.提供,一家受美國證券交易委員會(SEC)監管的持牌主體。 Moomoo Financial Inc.是金融業監管局(FINRA)和證券投資者保護公司(SIPC)的成員。
在新加坡,moomoo上的投資產品和服務是通過Moomoo Financial Singapore Pte. Ltd.提供,該公司受新加坡金融管理局(MAS)監管(牌照號碼︰CMS101000) ,持有資本市場服務牌照 (CMS) ,持有財務顧問豁免(Exempt Financial Adviser)資質。本內容未經新加坡金融管理局的審查。
在澳大利亞,moomoo上的金融產品和服務是通過Futu Securities (Australia) Ltd提供,該公司是受澳大利亞證券和投資委員會(ASIC)監管的澳大利亞金融服務許可機構(AFSL No. 224663)。請閱讀並理解我們的《金融服務指南》、《條款與條件》、《隱私政策》和其他披露文件,這些文件可在我們的網站 https://www.moomoo.com/au中獲取。
在加拿大,透過moomoo應用程式提供的僅限訂單執行的券商服務由Moomoo Financial Canada Inc.提供,並受加拿大投資監管機構(CIRO)監管。
在馬來西亞,moomoo上的投資產品和服務是透過Moomoo Securities Malaysia Sdn. Bhd. 提供,該公司受馬來西亞證券監督委員會(SC)監管(牌照號碼︰eCMSL/A0397/2024) ,持有資本市場服務牌照 (CMSL) 。本內容未經馬來西亞證券監督委員會的審查。
Moomoo Technologies Inc., Moomoo Financial Inc., Moomoo Financial Singapore Pte. Ltd.,Futu Securities (Australia) Ltd, Moomoo Financial Canada Inc和Moomoo Securities Malaysia Sdn. Bhd., 是關聯公司。
風險及免責聲明
moomoo是Moomoo Technologies Inc.公司提供的金融資訊和交易應用程式。
在美國,moomoo上的投資產品和服務由Moomoo Financial Inc.提供,一家受美國證券交易委員會(SEC)監管的持牌主體。 Moomoo Financial Inc.是金融業監管局(FINRA)和證券投資者保護公司(SIPC)的成員。
在新加坡,moomoo上的投資產品和服務是通過Moomoo Financial Singapore Pte. Ltd.提供,該公司受新加坡金融管理局(MAS)監管(牌照號碼︰CMS101000) ,持有資本市場服務牌照 (CMS) ,持有財務顧問豁免(Exempt Financial Adviser)資質。本內容未經新加坡金融管理局的審查。
在澳大利亞,moomoo上的金融產品和服務是通過Futu Securities (Australia) Ltd提供,該公司是受澳大利亞證券和投資委員會(ASIC)監管的澳大利亞金融服務許可機構(AFSL No. 224663)。請閱讀並理解我們的《金融服務指南》、《條款與條件》、《隱私政策》和其他披露文件,這些文件可在我們的網站 https://www.moomoo.com/au中獲取。
在加拿大,透過moomoo應用程式提供的僅限訂單執行的券商服務由Moomoo Financial Canada Inc.提供,並受加拿大投資監管機構(CIRO)監管。
在馬來西亞,moomoo上的投資產品和服務是透過Moomoo Securities Malaysia Sdn. Bhd. 提供,該公司受馬來西亞證券監督委員會(SC)監管(牌照號碼︰eCMSL/A0397/2024) ,持有資本市場服務牌照 (CMSL) 。本內容未經馬來西亞證券監督委員會的審查。
Moomoo Technologies Inc., Moomoo Financial Inc., Moomoo Financial Singapore Pte. Ltd.,Futu Securities (Australia) Ltd, Moomoo Financial Canada Inc和Moomoo Securities Malaysia Sdn. Bhd., 是關聯公司。
- 分享到weixin
- 分享到qq
- 分享到facebook
- 分享到twitter
- 分享到微博
- 粘贴板
使用瀏覽器的分享功能,分享給你的好友吧