
-
市場
-
產品
-
資訊
-
Moo社區
-
課堂
-
查看更多
-
功能介紹
-
費用費用透明,無最低余額限制
投資選擇、功能介紹、費用相關信息由Moomoo Financial Inc.提供
- English
- 中文繁體
- 中文简体
- 深色
- 淺色
Uni-President China Holdings' (HKG:220) Earnings Have Declined Over Three Years, Contributing to Shareholders 2.5% Loss
Uni-President China Holdings' (HKG:220) Earnings Have Declined Over Three Years, Contributing to Shareholders 2.5% Loss
One of the frustrations of investing is when a stock goes down. But no-one can make money on every call, especially in a declining market. The Uni-President China Holdings Ltd (HKG:220) is down 18% over three years, but the total shareholder return is -2.5% once you include the dividend. That's better than the market which declined 2.7% over the last three years. But it's up 9.1% in the last week.
Although the past week has been more reassuring for shareholders, they're still in the red over the last three years, so let's see if the underlying business has been responsible for the decline.
Check out our latest analysis for Uni-President China Holdings
While markets are a powerful pricing mechanism, share prices reflect investor sentiment, not just underlying business performance. One way to examine how market sentiment has changed over time is to look at the interaction between a company's share price and its earnings per share (EPS).
Uni-President China Holdings saw its EPS decline at a compound rate of 1.2% per year, over the last three years. The share price decline of 6% is actually steeper than the EPS slippage. So it's likely that the EPS decline has disappointed the market, leaving investors hesitant to buy.
You can see how EPS has changed over time in the image below (click on the chart to see the exact values).
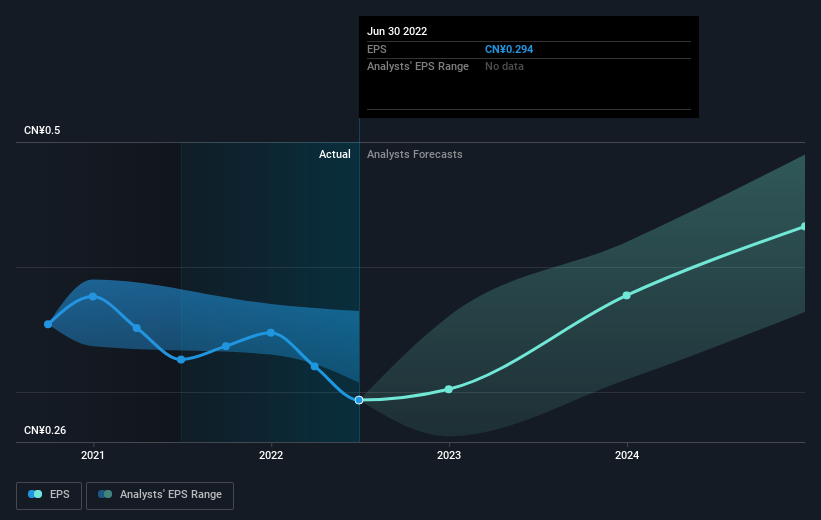 SEHK:220 Earnings Per Share Growth September 22nd 2022
Dive deeper into Uni-President China Holdings' key metrics by checking this interactive graph of Uni-President China Holdings's earnings, revenue and cash flow.
What About Dividends?
When looking at investment returns, it is important to consider the difference between total shareholder return (TSR) and share price return. The TSR incorporates the value of any spin-offs or discounted capital raisings, along with any dividends, based on the assumption that the dividends are reinvested. It's fair to say that the TSR gives a more complete picture for stocks that pay a dividend. We note that for Uni-President China Holdings the TSR over the last 3 years was -2.5%, which is better than the share price return mentioned above. And there's no prize for guessing that the dividend payments largely explain the divergence!
A Different Perspective
It's nice to see that Uni-President China Holdings shareholders have received a total shareholder return of 2.6% over the last year. Of course, that includes the dividend. Since the one-year TSR is better than the five-year TSR (the latter coming in at 2% per year), it would seem that the stock's performance has improved in recent times. In the best case scenario, this may hint at some real business momentum, implying that now could be a great time to delve deeper. While it is well worth considering the different impacts that market conditions can have on the share price, there are other factors that are even more important. For instance, we've identified 1 warning sign for Uni-President China Holdings that you should be aware of.
Of course Uni-President China Holdings may not be the best stock to buy. So you may wish to see this free collection of growth stocks.
Please note, the market returns quoted in this article reflect the market weighted average returns of stocks that currently trade on HK exchanges.
Have feedback on this article? Concerned about the content? Get in touch with us directly. Alternatively, email editorial-team (at) simplywallst.com.
This article by Simply Wall St is general in nature. We provide commentary based on historical data and analyst forecasts only using an unbiased methodology and our articles are not intended to be financial advice. It does not constitute a recommendation to buy or sell any stock, and does not take account of your objectives, or your financial situation. We aim to bring you long-term focused analysis driven by fundamental data. Note that our analysis may not factor in the latest price-sensitive company announcements or qualitative material. Simply Wall St has no position in any stocks mentioned.
投資的挫折之一是當一隻股票下跌時。但沒有人能在每一通電話上都賺錢,特別是在市場下跌的情況下。這個統一-總裁中國控股有限公司(HKG:220)過去三年下跌了18%,但如果計入股息,總股東回報率為-2.5%。這比過去三年下跌2.7%的市場要好。但最近一週上漲了9.1%。
儘管過去一週對股東來説更令人安心,但他們在過去三年仍處於虧損狀態,所以讓我們看看基礎業務是否對股價下跌負有責任。
查看我們對統一-總裁中國控股的最新分析
雖然市場是一種強大的定價機制,但股價反映的是投資者情緒,而不僅僅是潛在的企業表現。考察市場情緒如何隨時間變化的一種方法是觀察一家公司的股價和每股收益(EPS)之間的相互作用。
在過去的三年裏,統一總裁中國控股的每股收益以每年1.2%的複合速度下降。6%的股價跌幅實際上比每股收益下滑幅度更大。因此,很可能是每股收益的下降令市場失望,讓投資者對買入猶豫不決。
您可以在下圖中看到EPS是如何隨着時間的推移而變化的(單擊圖表可查看精確值)。
聯交所:220每股盈利增長2022年9月22日通過查看這張關於總裁中國控股的收益、收入和現金流的互動圖,更深入地瞭解總裁中國控股的關鍵指標。
那股息呢?
在考察投資回報時,重要的是要考慮到股東總回報(TSR)和股價回報。TSR包括任何剝離或貼現融資的價值,以及任何股息,基於股息再投資的假設。公平地説,TSR為支付股息的股票提供了更完整的圖景。我們注意到,對於統一-總裁中國控股,過去3年的TSR為-2.5%,好於上面提到的股價回報。而且,猜測股息支付在很大程度上解釋了這種差異是沒有好處的!
不同的視角
很高興看到統一-總裁中國控股的股東在過去一年中獲得了2.6%的總股東回報。當然,這包括股息。由於一年期的TSR好於五年期的TSR(後者的年利率為2%),看起來該股的表現在最近有所改善。在最好的情況下,這可能暗示着一些真正的商業勢頭,意味着現在可能是深入研究的好時機。雖然值得考慮市場狀況對股價可能產生的不同影響,但還有其他更重要的因素。例如,我們已經確定統一-總裁中國控股公司的1個警告標誌這一點你應該知道。
當然了統一-總裁中國控股可能不是最值得買入的股票。所以你可能想看看這個免費成長型股票的集合。
請注意,本文引用的市場回報反映了目前在香港交易所交易的股票的市場加權平均回報。
對這篇文章有什麼反饋嗎?擔心內容嗎? 保持聯繫直接與我們聯繫。或者,也可以給編輯組發電子郵件,地址是implywallst.com。
本文由Simply Wall St.撰寫,具有概括性。我們僅使用不偏不倚的方法提供基於歷史數據和分析師預測的評論,我們的文章並不打算作為財務建議。它不構成買賣任何股票的建議,也沒有考慮你的目標或你的財務狀況。我們的目標是為您帶來由基本面數據驅動的長期重點分析。請注意,我們的分析可能不會將最新的對價格敏感的公司公告或定性材料考慮在內。Simply Wall St.對上述任何一隻股票都沒有持倉。
moomoo是Moomoo Technologies Inc.公司提供的金融資訊和交易應用程式。
在美國,moomoo上的投資產品和服務由Moomoo Financial Inc.提供,一家受美國證券交易委員會(SEC)監管的持牌主體。 Moomoo Financial Inc.是金融業監管局(FINRA)和證券投資者保護公司(SIPC)的成員。
在新加坡,moomoo上的投資產品和服務是通過Moomoo Financial Singapore Pte. Ltd.提供,該公司受新加坡金融管理局(MAS)監管(牌照號碼︰CMS101000) ,持有資本市場服務牌照 (CMS) ,持有財務顧問豁免(Exempt Financial Adviser)資質。本內容未經新加坡金融管理局的審查。
在澳大利亞,moomoo上的金融產品和服務是通過Futu Securities (Australia) Ltd提供,該公司是受澳大利亞證券和投資委員會(ASIC)監管的澳大利亞金融服務許可機構(AFSL No. 224663)。請閱讀並理解我們的《金融服務指南》、《條款與條件》、《隱私政策》和其他披露文件,這些文件可在我們的網站 https://www.moomoo.com/au中獲取。
在加拿大,透過moomoo應用程式提供的僅限訂單執行的券商服務由Moomoo Financial Canada Inc.提供,並受加拿大投資監管機構(CIRO)監管。
在馬來西亞,moomoo上的投資產品和服務是透過Moomoo Securities Malaysia Sdn. Bhd. 提供,該公司受馬來西亞證券監督委員會(SC)監管(牌照號碼︰eCMSL/A0397/2024) ,持有資本市場服務牌照 (CMSL) 。本內容未經馬來西亞證券監督委員會的審查。
Moomoo Technologies Inc., Moomoo Financial Inc., Moomoo Financial Singapore Pte. Ltd.,Futu Securities (Australia) Ltd, Moomoo Financial Canada Inc和Moomoo Securities Malaysia Sdn. Bhd., 是關聯公司。
風險及免責聲明
moomoo是Moomoo Technologies Inc.公司提供的金融資訊和交易應用程式。
在美國,moomoo上的投資產品和服務由Moomoo Financial Inc.提供,一家受美國證券交易委員會(SEC)監管的持牌主體。 Moomoo Financial Inc.是金融業監管局(FINRA)和證券投資者保護公司(SIPC)的成員。
在新加坡,moomoo上的投資產品和服務是通過Moomoo Financial Singapore Pte. Ltd.提供,該公司受新加坡金融管理局(MAS)監管(牌照號碼︰CMS101000) ,持有資本市場服務牌照 (CMS) ,持有財務顧問豁免(Exempt Financial Adviser)資質。本內容未經新加坡金融管理局的審查。
在澳大利亞,moomoo上的金融產品和服務是通過Futu Securities (Australia) Ltd提供,該公司是受澳大利亞證券和投資委員會(ASIC)監管的澳大利亞金融服務許可機構(AFSL No. 224663)。請閱讀並理解我們的《金融服務指南》、《條款與條件》、《隱私政策》和其他披露文件,這些文件可在我們的網站 https://www.moomoo.com/au中獲取。
在加拿大,透過moomoo應用程式提供的僅限訂單執行的券商服務由Moomoo Financial Canada Inc.提供,並受加拿大投資監管機構(CIRO)監管。
在馬來西亞,moomoo上的投資產品和服務是透過Moomoo Securities Malaysia Sdn. Bhd. 提供,該公司受馬來西亞證券監督委員會(SC)監管(牌照號碼︰eCMSL/A0397/2024) ,持有資本市場服務牌照 (CMSL) 。本內容未經馬來西亞證券監督委員會的審查。
Moomoo Technologies Inc., Moomoo Financial Inc., Moomoo Financial Singapore Pte. Ltd.,Futu Securities (Australia) Ltd, Moomoo Financial Canada Inc和Moomoo Securities Malaysia Sdn. Bhd., 是關聯公司。
- 分享到weixin
- 分享到qq
- 分享到facebook
- 分享到twitter
- 分享到微博
- 粘贴板
使用瀏覽器的分享功能,分享給你的好友吧