
-
市場
-
產品
-
資訊
-
Moo社區
-
課堂
-
查看更多
-
功能介紹
-
費用費用透明,無最低余額限制
投資選擇、功能介紹、費用相關信息由Moomoo Financial Inc.提供
- English
- 中文繁體
- 中文简体
- 深色
- 淺色
Are Strong Financial Prospects The Force That Is Driving The Momentum In Fabrinet's NYSE:FN) Stock?
Are Strong Financial Prospects The Force That Is Driving The Momentum In Fabrinet's NYSE:FN) Stock?
Fabrinet (NYSE:FN) has had a great run on the share market with its stock up by a significant 24% over the last three months. Given the company's impressive performance, we decided to study its financial indicators more closely as a company's financial health over the long-term usually dictates market outcomes. Particularly, we will be paying attention to Fabrinet's ROE today.
Return on Equity or ROE is a test of how effectively a company is growing its value and managing investors' money. Simply put, it is used to assess the profitability of a company in relation to its equity capital.
See our latest analysis for Fabrinet
How Is ROE Calculated?
ROE can be calculated by using the formula:
Return on Equity = Net Profit (from continuing operations) ÷ Shareholders' Equity
So, based on the above formula, the ROE for Fabrinet is:
16% = US$200m ÷ US$1.3b (Based on the trailing twelve months to June 2022).
The 'return' is the amount earned after tax over the last twelve months. That means that for every $1 worth of shareholders' equity, the company generated $0.16 in profit.
What Has ROE Got To Do With Earnings Growth?
We have already established that ROE serves as an efficient profit-generating gauge for a company's future earnings. We now need to evaluate how much profit the company reinvests or "retains" for future growth which then gives us an idea about the growth potential of the company. Assuming everything else remains unchanged, the higher the ROE and profit retention, the higher the growth rate of a company compared to companies that don't necessarily bear these characteristics.
A Side By Side comparison of Fabrinet's Earnings Growth And 16% ROE
To start with, Fabrinet's ROE looks acceptable. Further, the company's ROE is similar to the industry average of 14%. This probably goes some way in explaining Fabrinet's moderate 16% growth over the past five years amongst other factors.
As a next step, we compared Fabrinet's net income growth with the industry and found that the company has a similar growth figure when compared with the industry average growth rate of 17% in the same period.
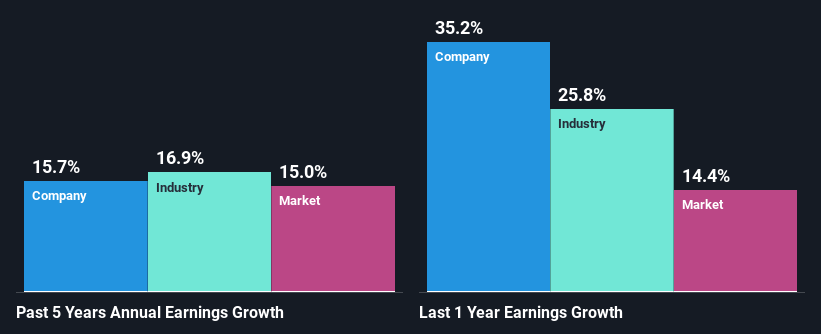 NYSE:FN Past Earnings Growth September 21st 2022
Earnings growth is a huge factor in stock valuation. The investor should try to establish if the expected growth or decline in earnings, whichever the case may be, is priced in. This then helps them determine if the stock is placed for a bright or bleak future. What is FN worth today? The intrinsic value infographic in our free research report helps visualize whether FN is currently mispriced by the market.
Is Fabrinet Using Its Retained Earnings Effectively?
Fabrinet doesn't pay any dividend, meaning that all of its profits are being reinvested in the business, which explains the fair bit of earnings growth the company has seen.
Conclusion
In total, we are pretty happy with Fabrinet's performance. In particular, it's great to see that the company is investing heavily into its business and along with a high rate of return, that has resulted in a sizeable growth in its earnings. If the company continues to grow its earnings the way it has, that could have a positive impact on its share price given how earnings per share influence long-term share prices. Remember, the price of a stock is also dependent on the perceived risk. Therefore investors must keep themselves informed about the risks involved before investing in any company. You can see the 2 risks we have identified for Fabrinet by visiting our risks dashboard for free on our platform here.
Have feedback on this article? Concerned about the content? Get in touch with us directly. Alternatively, email editorial-team (at) simplywallst.com.
This article by Simply Wall St is general in nature. We provide commentary based on historical data and analyst forecasts only using an unbiased methodology and our articles are not intended to be financial advice. It does not constitute a recommendation to buy or sell any stock, and does not take account of your objectives, or your financial situation. We aim to bring you long-term focused analysis driven by fundamental data. Note that our analysis may not factor in the latest price-sensitive company announcements or qualitative material. Simply Wall St has no position in any stocks mentioned.
Fabrinet(紐約證券交易所代碼:FN)的股票在過去三個月裏大幅上漲了24%,在股票市場上表現出色。鑑於該公司令人印象深刻的業績,我們決定更仔細地研究其財務指標,因為公司的長期財務健康狀況通常決定着市場結果。特別是,我們今天將關注法布里內特的淨資產收益率。
股本回報率(ROE)是對一家公司增值和管理投資者資金的效率的測試。簡而言之,它是用來評估一家公司相對於其權益資本的盈利能力。
查看我們對Fabrnet的最新分析
淨資產收益率是如何計算的?
可使用以下公式計算淨資產收益率:
股本回報率=(持續經營的)淨利潤?股東權益
因此,根據上面的公式,Fabrnet的淨資產收益率為:
16%=2億美元×13億美元(基於截至2022年6月的12個月)。
“報税表”是過去12個月的税後收入。這意味着,股東權益每增加1美元,公司就會產生0.16美元的利潤。
淨資產收益率與盈利增長有什麼關係?
我們已經證實,淨資產收益率是一家公司未來收益的有效盈利指標。我們現在需要評估公司將多少利潤再投資或“保留”用於未來的增長,這就讓我們對公司的增長潛力有了一個瞭解。假設其他條件不變,淨資產收益率和利潤保留率越高,與不一定具有這些特徵的公司相比,公司的增長率就越高。
法布里內盈利增長與16%淨資產收益率的並列比較
首先,法布里內的淨資產收益率看起來還可以接受。此外,該公司的淨資產收益率(ROE)接近14%的行業平均水平。這可能在一定程度上解釋了法布里內特在過去五年中16%的温和增長,以及其他因素。
下一步,我們將法布里內的淨收入增長與行業進行比較,發現該公司的增長數字與同期17%的行業平均增長率相似。
紐約證券交易所:FN過去的收益增長2022年9月21日盈利增長是股票估值的一個重要因素。投資者應該嘗試確定預期的收益增長或下降是否已計入價格,無論是哪種情況。這有助於他們確定這隻股票是為光明還是黯淡的未來做準備。今天的國民陣線值多少錢?我們免費研究報告中的內在價值信息圖有助於直觀地瞭解FN目前是否被市場錯誤定價。
Fabrnet是否有效地利用了其留存收益?
Fabrnet不支付任何股息,這意味着它的所有利潤都將再投資於業務,這就解釋了該公司的收益增長相當可觀。
結論
總體而言,我們對法布里內的表現相當滿意。特別是,很高興看到該公司在業務上投入了大量資金,並獲得了高回報率,這導致了其收益的可觀增長。如果該公司繼續以目前的方式增長收益,考慮到每股收益對長期股價的影響,這可能會對其股價產生積極影響。記住,股票的價格也取決於感知到的風險。因此,投資者在投資任何公司之前,必須隨時瞭解所涉及的風險。您可以通過訪問我們的風險控制面板在我們的平臺上是免費的。
對這篇文章有什麼反饋嗎?擔心內容嗎? 保持聯繫直接與我們聯繫。或者,也可以給編輯組發電子郵件,地址是implywallst.com。
本文由Simply Wall St.撰寫,具有概括性。我們僅使用不偏不倚的方法提供基於歷史數據和分析師預測的評論,我們的文章並不打算作為財務建議。它不構成買賣任何股票的建議,也沒有考慮你的目標或你的財務狀況。我們的目標是為您帶來由基本面數據驅動的長期重點分析。請注意,我們的分析可能不會將最新的對價格敏感的公司公告或定性材料考慮在內。Simply Wall St.對上述任何一隻股票都沒有持倉。
moomoo是Moomoo Technologies Inc.公司提供的金融資訊和交易應用程式。
在美國,moomoo上的投資產品和服務由Moomoo Financial Inc.提供,一家受美國證券交易委員會(SEC)監管的持牌主體。 Moomoo Financial Inc.是金融業監管局(FINRA)和證券投資者保護公司(SIPC)的成員。
在新加坡,moomoo上的投資產品和服務是通過Moomoo Financial Singapore Pte. Ltd.提供,該公司受新加坡金融管理局(MAS)監管(牌照號碼︰CMS101000) ,持有資本市場服務牌照 (CMS) ,持有財務顧問豁免(Exempt Financial Adviser)資質。本內容未經新加坡金融管理局的審查。
在澳大利亞,moomoo上的金融產品和服務是通過Futu Securities (Australia) Ltd提供,該公司是受澳大利亞證券和投資委員會(ASIC)監管的澳大利亞金融服務許可機構(AFSL No. 224663)。請閱讀並理解我們的《金融服務指南》、《條款與條件》、《隱私政策》和其他披露文件,這些文件可在我們的網站 https://www.moomoo.com/au中獲取。
在加拿大,透過moomoo應用程式提供的僅限訂單執行的券商服務由Moomoo Financial Canada Inc.提供,並受加拿大投資監管機構(CIRO)監管。
在馬來西亞,moomoo上的投資產品和服務是透過Moomoo Securities Malaysia Sdn. Bhd. 提供,該公司受馬來西亞證券監督委員會(SC)監管(牌照號碼︰eCMSL/A0397/2024) ,持有資本市場服務牌照 (CMSL) 。本內容未經馬來西亞證券監督委員會的審查。
Moomoo Technologies Inc., Moomoo Financial Inc., Moomoo Financial Singapore Pte. Ltd.,Futu Securities (Australia) Ltd, Moomoo Financial Canada Inc和Moomoo Securities Malaysia Sdn. Bhd., 是關聯公司。
風險及免責聲明
moomoo是Moomoo Technologies Inc.公司提供的金融資訊和交易應用程式。
在美國,moomoo上的投資產品和服務由Moomoo Financial Inc.提供,一家受美國證券交易委員會(SEC)監管的持牌主體。 Moomoo Financial Inc.是金融業監管局(FINRA)和證券投資者保護公司(SIPC)的成員。
在新加坡,moomoo上的投資產品和服務是通過Moomoo Financial Singapore Pte. Ltd.提供,該公司受新加坡金融管理局(MAS)監管(牌照號碼︰CMS101000) ,持有資本市場服務牌照 (CMS) ,持有財務顧問豁免(Exempt Financial Adviser)資質。本內容未經新加坡金融管理局的審查。
在澳大利亞,moomoo上的金融產品和服務是通過Futu Securities (Australia) Ltd提供,該公司是受澳大利亞證券和投資委員會(ASIC)監管的澳大利亞金融服務許可機構(AFSL No. 224663)。請閱讀並理解我們的《金融服務指南》、《條款與條件》、《隱私政策》和其他披露文件,這些文件可在我們的網站 https://www.moomoo.com/au中獲取。
在加拿大,透過moomoo應用程式提供的僅限訂單執行的券商服務由Moomoo Financial Canada Inc.提供,並受加拿大投資監管機構(CIRO)監管。
在馬來西亞,moomoo上的投資產品和服務是透過Moomoo Securities Malaysia Sdn. Bhd. 提供,該公司受馬來西亞證券監督委員會(SC)監管(牌照號碼︰eCMSL/A0397/2024) ,持有資本市場服務牌照 (CMSL) 。本內容未經馬來西亞證券監督委員會的審查。
Moomoo Technologies Inc., Moomoo Financial Inc., Moomoo Financial Singapore Pte. Ltd.,Futu Securities (Australia) Ltd, Moomoo Financial Canada Inc和Moomoo Securities Malaysia Sdn. Bhd., 是關聯公司。
- 分享到weixin
- 分享到qq
- 分享到facebook
- 分享到twitter
- 分享到微博
- 粘贴板
使用瀏覽器的分享功能,分享給你的好友吧