
-
市場
-
產品
-
資訊
-
Moo社區
-
課堂
-
查看更多
-
功能介紹
-
費用費用透明,無最低余額限制
投資選擇、功能介紹、費用相關信息由Moomoo Financial Inc.提供
- English
- 中文繁體
- 中文简体
- 深色
- 淺色
STAG Industrial, Inc.'s (NYSE:STAG) Stock Has Shown Weakness Lately But Financial Prospects Look Decent: Is The Market Wrong?
STAG Industrial, Inc.'s (NYSE:STAG) Stock Has Shown Weakness Lately But Financial Prospects Look Decent: Is The Market Wrong?
With its stock down 9.1% over the past month, it is easy to disregard STAG Industrial (NYSE:STAG). However, the company's fundamentals look pretty decent, and long-term financials are usually aligned with future market price movements. Particularly, we will be paying attention to STAG Industrial's ROE today.
ROE or return on equity is a useful tool to assess how effectively a company can generate returns on the investment it received from its shareholders. In other words, it is a profitability ratio which measures the rate of return on the capital provided by the company's shareholders.
Check out our latest analysis for STAG Industrial
How Is ROE Calculated?
Return on equity can be calculated by using the formula:
Return on Equity = Net Profit (from continuing operations) ÷ Shareholders' Equity
So, based on the above formula, the ROE for STAG Industrial is:
6.5% = US$225m ÷ US$3.5b (Based on the trailing twelve months to June 2022).
The 'return' is the amount earned after tax over the last twelve months. One way to conceptualize this is that for each $1 of shareholders' capital it has, the company made $0.07 in profit.
What Is The Relationship Between ROE And Earnings Growth?
We have already established that ROE serves as an efficient profit-generating gauge for a company's future earnings. Based on how much of its profits the company chooses to reinvest or "retain", we are then able to evaluate a company's future ability to generate profits. Assuming everything else remains unchanged, the higher the ROE and profit retention, the higher the growth rate of a company compared to companies that don't necessarily bear these characteristics.
A Side By Side comparison of STAG Industrial's Earnings Growth And 6.5% ROE
On the face of it, STAG Industrial's ROE is not much to talk about. However, given that the company's ROE is similar to the average industry ROE of 6.6%, we may spare it some thought. Moreover, we are quite pleased to see that STAG Industrial's net income grew significantly at a rate of 39% over the last five years. Taking into consideration that the ROE is not particularly high, we reckon that there could also be other factors at play which could be influencing the company's growth. Such as - high earnings retention or an efficient management in place.
As a next step, we compared STAG Industrial's net income growth with the industry, and pleasingly, we found that the growth seen by the company is higher than the average industry growth of 11%.
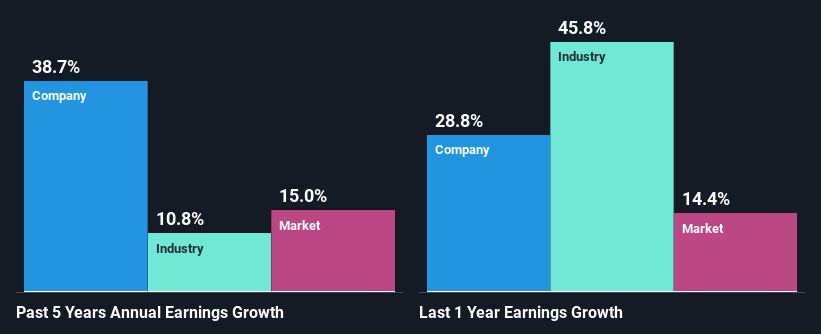 NYSE:STAG Past Earnings Growth September 21st 2022
Earnings growth is a huge factor in stock valuation. It's important for an investor to know whether the market has priced in the company's expected earnings growth (or decline). Doing so will help them establish if the stock's future looks promising or ominous. If you're wondering about STAG Industrial's's valuation, check out this gauge of its price-to-earnings ratio, as compared to its industry.
Is STAG Industrial Efficiently Re-investing Its Profits?
STAG Industrial has a very high three-year median payout ratio of 79%. This means that it has only 21% of its income left to reinvest into its business. However, it's not unusual to see a REIT with such a high payout ratio mainly due to statutory requirements. In spite of this, the company was able to grow its earnings significantly, as we saw above.
Additionally, STAG Industrial has paid dividends over a period of at least ten years which means that the company is pretty serious about sharing its profits with shareholders. Based on the latest analysts' estimates, we found that the company's future payout ratio over the next three years is expected to hold steady at 68%. Still, forecasts suggest that STAG Industrial's future ROE will drop to 3.9% even though the the company's payout ratio is not expected to change by much.
Conclusion
In total, it does look like STAG Industrial has some positive aspects to its business. While no doubt its earnings growth is pretty substantial, we do feel that the reinvestment rate is pretty low, meaning, the earnings growth number could have been significantly higher had the company been retaining more of its profits. Having said that, on studying current analyst estimates, we were concerned to see that while the company has grown its earnings in the past, analysts expect its earnings to shrink in the future. Are these analysts expectations based on the broad expectations for the industry, or on the company's fundamentals? Click here to be taken to our analyst's forecasts page for the company.
Have feedback on this article? Concerned about the content? Get in touch with us directly. Alternatively, email editorial-team (at) simplywallst.com.
This article by Simply Wall St is general in nature. We provide commentary based on historical data and analyst forecasts only using an unbiased methodology and our articles are not intended to be financial advice. It does not constitute a recommendation to buy or sell any stock, and does not take account of your objectives, or your financial situation. We aim to bring you long-term focused analysis driven by fundamental data. Note that our analysis may not factor in the latest price-sensitive company announcements or qualitative material. Simply Wall St has no position in any stocks mentioned.
由於其股價在過去一個月裏下跌了9.1%,人們很容易忽視STAG工業公司(紐約證券交易所代碼:STAG)。然而,該公司的基本面看起來相當不錯,長期財務狀況通常與未來的市場價格走勢保持一致。特別是今天我們將關注雄鹿實業的淨資產收益率。
淨資產收益率,即股本回報率,是評估一家公司從股東那裏獲得投資回報的有效程度的有用工具。換句話説,這是一個衡量公司股東提供的資本回報率的盈利比率。
查看我們對STAG Industrial的最新分析
淨資產收益率是如何計算的?
股本回報率可使用以下公式計算:
股本回報率=(持續經營的)淨利潤?股東權益
因此,根據上述公式,STAG Industrial的淨資產收益率為:
6.5%=2.25億美元×35億美元(基於截至2022年6月的12個月)。
“報税表”是過去12個月的税後收入。一種將其概念化的方法是,公司每擁有1美元的股東資本,就能獲得0.07美元的利潤。
淨資產收益率與盈利增長之間有什麼關係?
我們已經證實,淨資產收益率是一家公司未來收益的有效盈利指標。根據公司選擇再投資或“保留”多少利潤,我們就能夠評估一家公司未來產生利潤的能力。假設其他條件不變,淨資產收益率和利潤保留率越高,與不一定具有這些特徵的公司相比,公司的增長率就越高。
斯塔格實業盈利增長與6.5%淨資產收益率的並列比較
從表面上看,雄鹿工業的淨資產收益率(ROE)並不值得談論。然而,鑑於該公司的淨資產收益率與行業平均6.6%的淨資產收益率相似,我們或許可以省去一些思考。此外,我們非常高興地看到,在過去的五年中,雄鹿工業的淨收入以39%的速度大幅增長。考慮到淨資產收益率不是特別高,我們認為也可能有其他因素在發揮作用,可能正在影響公司的增長。例如-高收益留存或有效的管理到位。
作為下一步,我們將雄鹿實業的淨收入增長與行業進行了比較,令人欣喜的是,我們發現該公司看到的增長高於行業平均11%的增長。
紐約證券交易所:穩定過去的收益增長2022年9月21日盈利增長是股票估值的一個重要因素。對於投資者來説,重要的是知道市場是否已經消化了公司預期的收益增長(或下降)。這樣做將有助於他們確定該股的未來看起來是光明的還是不祥的。如果你想知道雄鹿實業的估值,看看這個衡量其市盈率的指標,與其行業相比。
雄鹿工業是否有效地對其利潤進行了再投資?
STAG Industrial的三年中值派息率非常高,為79%。這意味着它只剩下21%的收入可以再投資於其業務。然而,主要由於法定要求,REIT的派息率如此之高並不少見。儘管如此,正如我們上面看到的那樣,該公司的收益仍能大幅增長。
此外,雄鹿工業至少在十年內分紅,這意味着該公司對與股東分享利潤是相當認真的。根據最新的分析師預估,我們發現該公司未來三年的派息比率預計將穩定在68%。不過,預測顯示,儘管STAG Industrial的派息率預計不會有太大變化,但該公司未來的淨資產收益率將降至3.9%。
結論
總體而言,雄鹿工業的業務確實有一些積極的方面。雖然毫無疑問,它的收益增長相當可觀,但我們確實感覺到再投資率相當低,這意味着,如果公司保留了更多的利潤,收益增長數字可能會高得多。話雖如此,在研究目前分析師的預測時,我們擔心的是,儘管該公司過去的收益有所增長,但分析師預計其未來的收益將會萎縮。這些分析師的預期是基於對該行業的廣泛預期,還是基於該公司的基本面?點擊此處進入我們分析師對該公司的預測頁面。
對這篇文章有什麼反饋嗎?擔心內容嗎? 保持聯繫直接與我們聯繫。或者,也可以給編輯組發電子郵件,地址是implywallst.com。
本文由Simply Wall St.撰寫,具有概括性。我們僅使用不偏不倚的方法提供基於歷史數據和分析師預測的評論,我們的文章並不打算作為財務建議。它不構成買賣任何股票的建議,也沒有考慮你的目標或你的財務狀況。我們的目標是為您帶來由基本面數據驅動的長期重點分析。請注意,我們的分析可能不會將最新的對價格敏感的公司公告或定性材料考慮在內。Simply Wall St.對上述任何一隻股票都沒有持倉。
moomoo是Moomoo Technologies Inc.公司提供的金融資訊和交易應用程式。
在美國,moomoo上的投資產品和服務由Moomoo Financial Inc.提供,一家受美國證券交易委員會(SEC)監管的持牌主體。 Moomoo Financial Inc.是金融業監管局(FINRA)和證券投資者保護公司(SIPC)的成員。
在新加坡,moomoo上的投資產品和服務是通過Moomoo Financial Singapore Pte. Ltd.提供,該公司受新加坡金融管理局(MAS)監管(牌照號碼︰CMS101000) ,持有資本市場服務牌照 (CMS) ,持有財務顧問豁免(Exempt Financial Adviser)資質。本內容未經新加坡金融管理局的審查。
在澳大利亞,moomoo上的金融產品和服務是通過Futu Securities (Australia) Ltd提供,該公司是受澳大利亞證券和投資委員會(ASIC)監管的澳大利亞金融服務許可機構(AFSL No. 224663)。請閱讀並理解我們的《金融服務指南》、《條款與條件》、《隱私政策》和其他披露文件,這些文件可在我們的網站 https://www.moomoo.com/au中獲取。
在加拿大,透過moomoo應用程式提供的僅限訂單執行的券商服務由Moomoo Financial Canada Inc.提供,並受加拿大投資監管機構(CIRO)監管。
在馬來西亞,moomoo上的投資產品和服務是透過Moomoo Securities Malaysia Sdn. Bhd. 提供,該公司受馬來西亞證券監督委員會(SC)監管(牌照號碼︰eCMSL/A0397/2024) ,持有資本市場服務牌照 (CMSL) 。本內容未經馬來西亞證券監督委員會的審查。
Moomoo Technologies Inc., Moomoo Financial Inc., Moomoo Financial Singapore Pte. Ltd.,Futu Securities (Australia) Ltd, Moomoo Financial Canada Inc和Moomoo Securities Malaysia Sdn. Bhd., 是關聯公司。
風險及免責聲明
moomoo是Moomoo Technologies Inc.公司提供的金融資訊和交易應用程式。
在美國,moomoo上的投資產品和服務由Moomoo Financial Inc.提供,一家受美國證券交易委員會(SEC)監管的持牌主體。 Moomoo Financial Inc.是金融業監管局(FINRA)和證券投資者保護公司(SIPC)的成員。
在新加坡,moomoo上的投資產品和服務是通過Moomoo Financial Singapore Pte. Ltd.提供,該公司受新加坡金融管理局(MAS)監管(牌照號碼︰CMS101000) ,持有資本市場服務牌照 (CMS) ,持有財務顧問豁免(Exempt Financial Adviser)資質。本內容未經新加坡金融管理局的審查。
在澳大利亞,moomoo上的金融產品和服務是通過Futu Securities (Australia) Ltd提供,該公司是受澳大利亞證券和投資委員會(ASIC)監管的澳大利亞金融服務許可機構(AFSL No. 224663)。請閱讀並理解我們的《金融服務指南》、《條款與條件》、《隱私政策》和其他披露文件,這些文件可在我們的網站 https://www.moomoo.com/au中獲取。
在加拿大,透過moomoo應用程式提供的僅限訂單執行的券商服務由Moomoo Financial Canada Inc.提供,並受加拿大投資監管機構(CIRO)監管。
在馬來西亞,moomoo上的投資產品和服務是透過Moomoo Securities Malaysia Sdn. Bhd. 提供,該公司受馬來西亞證券監督委員會(SC)監管(牌照號碼︰eCMSL/A0397/2024) ,持有資本市場服務牌照 (CMSL) 。本內容未經馬來西亞證券監督委員會的審查。
Moomoo Technologies Inc., Moomoo Financial Inc., Moomoo Financial Singapore Pte. Ltd.,Futu Securities (Australia) Ltd, Moomoo Financial Canada Inc和Moomoo Securities Malaysia Sdn. Bhd., 是關聯公司。
- 分享到weixin
- 分享到qq
- 分享到facebook
- 分享到twitter
- 分享到微博
- 粘贴板
使用瀏覽器的分享功能,分享給你的好友吧