
-
市場
-
產品
-
資訊
-
Moo社區
-
課堂
-
查看更多
-
功能介紹
-
費用費用透明,無最低余額限制
投資選擇、功能介紹、費用相關信息由Moomoo Financial Inc.提供
- English
- 中文繁體
- 中文简体
- 深色
- 淺色
Triton International (NYSE:TRTN) Sheds 3.8% This Week, as Yearly Returns Fall More in Line With Earnings Growth
Triton International (NYSE:TRTN) Sheds 3.8% This Week, as Yearly Returns Fall More in Line With Earnings Growth
By buying an index fund, investors can approximate the average market return. But if you pick the right individual stocks, you could make more than that. For example, the Triton International Limited (NYSE:TRTN) share price is up 93% in the last three years, clearly besting the market return of around 36% (not including dividends). However, more recent returns haven't been as impressive as that, with the stock returning just 15% in the last year , including dividends .
Although Triton International has shed US$151m from its market cap this week, let's take a look at its longer term fundamental trends and see if they've driven returns.
See our latest analysis for Triton International
To quote Buffett, 'Ships will sail around the world but the Flat Earth Society will flourish. There will continue to be wide discrepancies between price and value in the marketplace...' One way to examine how market sentiment has changed over time is to look at the interaction between a company's share price and its earnings per share (EPS).
Triton International was able to grow its EPS at 35% per year over three years, sending the share price higher. The average annual share price increase of 24% is actually lower than the EPS growth. Therefore, it seems the market has moderated its expectations for growth, somewhat. This cautious sentiment is reflected in its (fairly low) P/E ratio of 5.77.
You can see how EPS has changed over time in the image below (click on the chart to see the exact values).
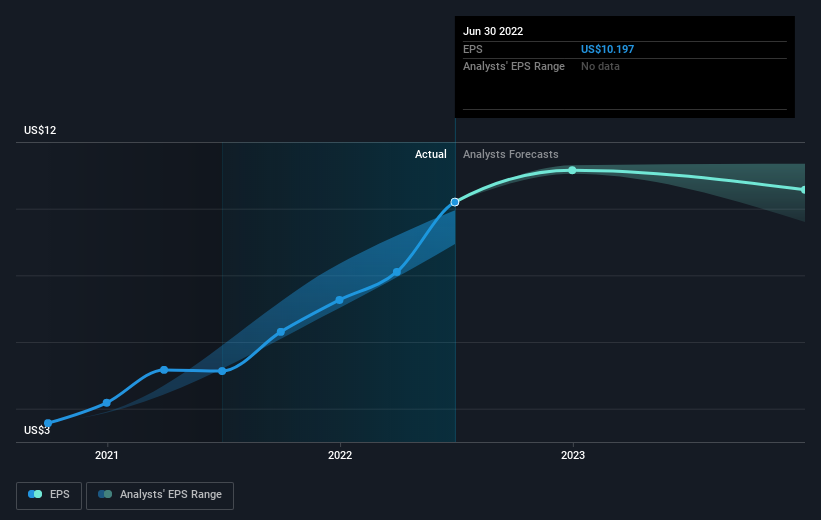 NYSE:TRTN Earnings Per Share Growth August 28th 2022
We know that Triton International has improved its bottom line over the last three years, but what does the future have in store? You can see how its balance sheet has strengthened (or weakened) over time in this free interactive graphic.
What About Dividends?
As well as measuring the share price return, investors should also consider the total shareholder return (TSR). The TSR is a return calculation that accounts for the value of cash dividends (assuming that any dividend received was reinvested) and the calculated value of any discounted capital raisings and spin-offs. Arguably, the TSR gives a more comprehensive picture of the return generated by a stock. In the case of Triton International, it has a TSR of 125% for the last 3 years. That exceeds its share price return that we previously mentioned. The dividends paid by the company have thusly boosted the total shareholder return.
A Different Perspective
We're pleased to report that Triton International shareholders have received a total shareholder return of 15% over one year. And that does include the dividend. However, the TSR over five years, coming in at 16% per year, is even more impressive. I find it very interesting to look at share price over the long term as a proxy for business performance. But to truly gain insight, we need to consider other information, too. Consider for instance, the ever-present spectre of investment risk. We've identified 3 warning signs with Triton International (at least 1 which shouldn't be ignored) , and understanding them should be part of your investment process.
If you would prefer to check out another company -- one with potentially superior financials -- then do not miss this free list of companies that have proven they can grow earnings.
Please note, the market returns quoted in this article reflect the market weighted average returns of stocks that currently trade on US exchanges.
Have feedback on this article? Concerned about the content? Get in touch with us directly. Alternatively, email editorial-team (at) simplywallst.com.
This article by Simply Wall St is general in nature. We provide commentary based on historical data and analyst forecasts only using an unbiased methodology and our articles are not intended to be financial advice. It does not constitute a recommendation to buy or sell any stock, and does not take account of your objectives, or your financial situation. We aim to bring you long-term focused analysis driven by fundamental data. Note that our analysis may not factor in the latest price-sensitive company announcements or qualitative material. Simply Wall St has no position in any stocks mentioned.
通過購買指數基金,投資者可以接近平均市場回報。但如果你選擇了正確的個股,你可以賺得更多。例如,Triton國際有限公司(紐約證券交易所代碼:TRTN)股價在過去三年中上漲了93%,顯然超過了約36%的市場回報率(不包括股息)。然而,最近的回報沒有那麼令人印象深刻,包括股息在內,該股去年的回報率僅為15%。
儘管Triton International本週市值縮水1.51億美元,但讓我們來看看其較長期的基本面趨勢,看看它們是否推動了回報。
查看我們對Triton International的最新分析
用巴菲特的話説,“船隻將在世界各地航行,但平坦的地球協會將蓬勃發展。市場上的價格和價值之間將繼續存在巨大的差異……”考察市場情緒如何隨時間變化的一種方法是觀察一家公司的股價和每股收益(EPS)之間的相互作用。
Triton International能夠在三年內以每年35%的速度增長每股收益,推動股價走高。平均每年24%的股價漲幅實際上低於每股收益的漲幅。因此,市場似乎在一定程度上降低了對增長的預期。這種謹慎的情緒反映在(相當低的)市盈率5.77。
您可以在下圖中看到EPS是如何隨着時間的推移而變化的(單擊圖表可查看精確值)。
紐約證券交易所:TRTN每股收益增長2022年8月28日我們知道Triton International在過去三年裏提高了利潤,但未來會是什麼樣子?你可以看到它的資產負債表是如何隨着時間的推移而加強(或削弱)的免費交互式圖形。
那股息呢?
除了衡量股價回報外,投資者還應考慮總股東回報(TSR)。TSR是一種回報計算,計入了現金股息的價值(假設收到的任何股息都進行了再投資),以及任何貼現融資和剝離的計算價值。可以説,TSR更全面地描繪了一隻股票產生的回報。就Triton International而言,它在過去3年的TSR為125%。這超過了我們之前提到的它的股價回報。該公司支付的股息因此提振了總計股東回報。
不同的視角
我們很高興地報告,Triton International的股東在一年內獲得了15%的總股東回報。這確實包括了股息。然而,五年來的TSR,以每年16%的速度增長,更令人印象深刻。我發現,把股價作為衡量企業業績的長期指標是非常有趣的。但為了真正獲得洞察力,我們還需要考慮其他信息。例如,考慮一下無處不在的投資風險幽靈。我們已經確定了三個警告信號與Triton International合作(至少有1個不應被忽視),瞭解它們應該是你投資過程的一部分。
如果你更願意看看另一家公司--一家財務狀況可能更好的公司--那麼不要錯過這一點免費已證明自己能夠實現盈利增長的公司名單。
請注意,本文引用的市場回報反映了目前在美國交易所交易的股票的市場加權平均回報。
對這篇文章有什麼反饋嗎?擔心內容嗎? 保持聯繫直接與我們聯繫。或者,也可以給編輯組發電子郵件,地址是implywallst.com。
本文由Simply Wall St.撰寫,具有概括性。我們僅使用不偏不倚的方法提供基於歷史數據和分析師預測的評論,我們的文章並不打算作為財務建議。它不構成買賣任何股票的建議,也沒有考慮你的目標或你的財務狀況。我們的目標是為您帶來由基本面數據驅動的長期重點分析。請注意,我們的分析可能不會將最新的對價格敏感的公司公告或定性材料考慮在內。Simply Wall St.對上述任何一隻股票都沒有持倉。
moomoo是Moomoo Technologies Inc.公司提供的金融資訊和交易應用程式。
在美國,moomoo上的投資產品和服務由Moomoo Financial Inc.提供,一家受美國證券交易委員會(SEC)監管的持牌主體。 Moomoo Financial Inc.是金融業監管局(FINRA)和證券投資者保護公司(SIPC)的成員。
在新加坡,moomoo上的投資產品和服務是通過Moomoo Financial Singapore Pte. Ltd.提供,該公司受新加坡金融管理局(MAS)監管(牌照號碼︰CMS101000) ,持有資本市場服務牌照 (CMS) ,持有財務顧問豁免(Exempt Financial Adviser)資質。本內容未經新加坡金融管理局的審查。
在澳大利亞,moomoo上的金融產品和服務是通過Futu Securities (Australia) Ltd提供,該公司是受澳大利亞證券和投資委員會(ASIC)監管的澳大利亞金融服務許可機構(AFSL No. 224663)。請閱讀並理解我們的《金融服務指南》、《條款與條件》、《隱私政策》和其他披露文件,這些文件可在我們的網站 https://www.moomoo.com/au中獲取。
在加拿大,透過moomoo應用程式提供的僅限訂單執行的券商服務由Moomoo Financial Canada Inc.提供,並受加拿大投資監管機構(CIRO)監管。
在馬來西亞,moomoo上的投資產品和服務是透過Moomoo Securities Malaysia Sdn. Bhd. 提供,該公司受馬來西亞證券監督委員會(SC)監管(牌照號碼︰eCMSL/A0397/2024) ,持有資本市場服務牌照 (CMSL) 。本內容未經馬來西亞證券監督委員會的審查。
Moomoo Technologies Inc., Moomoo Financial Inc., Moomoo Financial Singapore Pte. Ltd.,Futu Securities (Australia) Ltd, Moomoo Financial Canada Inc和Moomoo Securities Malaysia Sdn. Bhd., 是關聯公司。
風險及免責聲明
moomoo是Moomoo Technologies Inc.公司提供的金融資訊和交易應用程式。
在美國,moomoo上的投資產品和服務由Moomoo Financial Inc.提供,一家受美國證券交易委員會(SEC)監管的持牌主體。 Moomoo Financial Inc.是金融業監管局(FINRA)和證券投資者保護公司(SIPC)的成員。
在新加坡,moomoo上的投資產品和服務是通過Moomoo Financial Singapore Pte. Ltd.提供,該公司受新加坡金融管理局(MAS)監管(牌照號碼︰CMS101000) ,持有資本市場服務牌照 (CMS) ,持有財務顧問豁免(Exempt Financial Adviser)資質。本內容未經新加坡金融管理局的審查。
在澳大利亞,moomoo上的金融產品和服務是通過Futu Securities (Australia) Ltd提供,該公司是受澳大利亞證券和投資委員會(ASIC)監管的澳大利亞金融服務許可機構(AFSL No. 224663)。請閱讀並理解我們的《金融服務指南》、《條款與條件》、《隱私政策》和其他披露文件,這些文件可在我們的網站 https://www.moomoo.com/au中獲取。
在加拿大,透過moomoo應用程式提供的僅限訂單執行的券商服務由Moomoo Financial Canada Inc.提供,並受加拿大投資監管機構(CIRO)監管。
在馬來西亞,moomoo上的投資產品和服務是透過Moomoo Securities Malaysia Sdn. Bhd. 提供,該公司受馬來西亞證券監督委員會(SC)監管(牌照號碼︰eCMSL/A0397/2024) ,持有資本市場服務牌照 (CMSL) 。本內容未經馬來西亞證券監督委員會的審查。
Moomoo Technologies Inc., Moomoo Financial Inc., Moomoo Financial Singapore Pte. Ltd.,Futu Securities (Australia) Ltd, Moomoo Financial Canada Inc和Moomoo Securities Malaysia Sdn. Bhd., 是關聯公司。
- 分享到weixin
- 分享到qq
- 分享到facebook
- 分享到twitter
- 分享到微博
- 粘贴板
使用瀏覽器的分享功能,分享給你的好友吧