
-
市場
-
產品
-
資訊
-
Moo社區
-
課堂
-
查看更多
-
功能介紹
-
費用費用透明,無最低余額限制
投資選擇、功能介紹、費用相關信息由Moomoo Financial Inc.提供
- English
- 中文繁體
- 中文简体
- 深色
- 淺色
Avery Dennison's (NYSE:AVY) investors will be pleased with their splendid 127% return over the last five years
Avery Dennison's (NYSE:AVY) investors will be pleased with their splendid 127% return over the last five years
When you buy shares in a company, it's worth keeping in mind the possibility that it could fail, and you could lose your money. But on a lighter note, a good company can see its share price rise well over 100%. One great example is Avery Dennison Corporation (NYSE:AVY) which saw its share price drive 108% higher over five years. It's also up 16% in about a month. This could be related to the recent financial results that were recently released - you could check the most recent data by reading our company report.
With that in mind, it's worth seeing if the company's underlying fundamentals have been the driver of long term performance, or if there are some discrepancies.
See our latest analysis for Avery Dennison
While markets are a powerful pricing mechanism, share prices reflect investor sentiment, not just underlying business performance. One way to examine how market sentiment has changed over time is to look at the interaction between a company's share price and its earnings per share (EPS).
Over half a decade, Avery Dennison managed to grow its earnings per share at 17% a year. This EPS growth is reasonably close to the 16% average annual increase in the share price. That suggests that the market sentiment around the company hasn't changed much over that time. Indeed, it would appear the share price is reacting to the EPS.
You can see how EPS has changed over time in the image below (click on the chart to see the exact values).
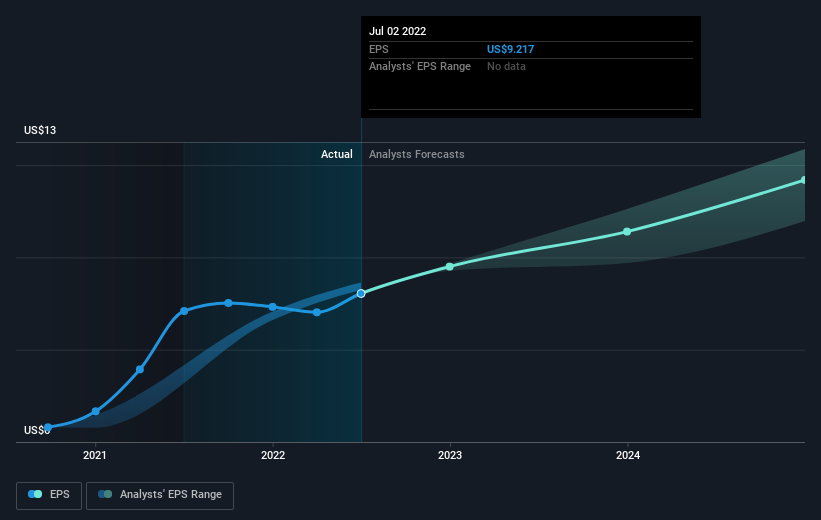 NYSE:AVY Earnings Per Share Growth August 7th 2022
It is of course excellent to see how Avery Dennison has grown profits over the years, but the future is more important for shareholders. This free interactive report on Avery Dennison's balance sheet strength is a great place to start, if you want to investigate the stock further.
What About Dividends?
It is important to consider the total shareholder return, as well as the share price return, for any given stock. The TSR incorporates the value of any spin-offs or discounted capital raisings, along with any dividends, based on the assumption that the dividends are reinvested. So for companies that pay a generous dividend, the TSR is often a lot higher than the share price return. In the case of Avery Dennison, it has a TSR of 127% for the last 5 years. That exceeds its share price return that we previously mentioned. And there's no prize for guessing that the dividend payments largely explain the divergence!
A Different Perspective
While it's certainly disappointing to see that Avery Dennison shares lost 8.0% throughout the year, that wasn't as bad as the market loss of 12%. Of course, the long term returns are far more important and the good news is that over five years, the stock has returned 18% for each year. In the best case scenario the last year is just a temporary blip on the journey to a brighter future. I find it very interesting to look at share price over the long term as a proxy for business performance. But to truly gain insight, we need to consider other information, too. For example, we've discovered 1 warning sign for Avery Dennison that you should be aware of before investing here.
If you would prefer to check out another company -- one with potentially superior financials -- then do not miss this free list of companies that have proven they can grow earnings.
Please note, the market returns quoted in this article reflect the market weighted average returns of stocks that currently trade on US exchanges.
Have feedback on this article? Concerned about the content? Get in touch with us directly. Alternatively, email editorial-team (at) simplywallst.com.
This article by Simply Wall St is general in nature. We provide commentary based on historical data and analyst forecasts only using an unbiased methodology and our articles are not intended to be financial advice. It does not constitute a recommendation to buy or sell any stock, and does not take account of your objectives, or your financial situation. We aim to bring you long-term focused analysis driven by fundamental data. Note that our analysis may not factor in the latest price-sensitive company announcements or qualitative material. Simply Wall St has no position in any stocks mentioned.
當你購買一家公司的股票時,值得記住的是它可能會倒閉,你可能會損失你的錢。但在較輕鬆的情況下,一家好公司的股價漲幅可以遠遠超過100%。一個很好的例子是艾弗裏·丹尼森公司(紐約證券交易所股票代碼:AVY),其股價在五年內上漲了108%。在大約一個月的時間裏,它也上漲了16%。這可能與最近發佈的財務業績有關-您可以通過閲讀我們的公司報告來查看最新的數據。
考慮到這一點,值得關注的是,該公司的潛在基本面是長期業績的驅動力,還是存在一些差異。
查看我們對艾弗裏·丹尼森的最新分析
雖然市場是一種強大的定價機制,但股價反映的是投資者情緒,而不僅僅是潛在的企業表現。考察市場情緒如何隨時間變化的一種方法是觀察一家公司的股價和每股收益(EPS)之間的相互作用。
在過去的五年裏,艾利丹尼森的每股收益以每年17%的速度增長。這一每股收益增長相當接近該公司股價16%的年均漲幅。這表明,在這段時間裏,圍繞該公司的市場情緒沒有太大變化。事實上,看起來股價是在對每股收益做出反應。
您可以在下圖中看到EPS是如何隨着時間的推移而變化的(單擊圖表可查看精確值)。
紐約證券交易所:Avy每股收益增長2022年8月7日看到艾利丹尼森多年來如何實現利潤增長當然很棒,但對股東來説,未來更重要。這免費如果你想進一步調查艾利丹尼森的股票,那麼關於艾利丹尼森資產負債表實力的互動報告是一個很好的起點。
那股息呢?
重要的是要考慮任何給定股票的總股東回報以及股價回報。TSR包括任何剝離或貼現融資的價值,以及任何股息,基於股息再投資的假設。因此,對於支付豐厚股息的公司來説,TSR往往比股價回報高得多。就艾利丹尼森而言,它在過去5年的TSR為127%。這超過了我們之前提到的它的股價回報。而且,猜測股息支付在很大程度上解釋了這種差異是沒有好處的!
不同的視角
雖然看到艾利丹尼森的股價全年下跌了8.0%,這當然令人失望,但這並沒有股市下跌12%那麼糟糕。當然,長期回報要重要得多,好消息是,在過去的五年裏,該股的年回報率為18%。在最好的情況下,去年只是通向更光明未來的旅途中的一個暫時的轉折點。我發現,把股價作為衡量企業業績的長期指標是非常有趣的。但為了真正獲得洞察力,我們還需要考慮其他信息。例如,我們發現艾弗裏·丹尼森的1個警告標誌在這裏投資之前你應該意識到這一點。
如果你更願意看看另一家公司--一家財務狀況可能更好的公司--那麼不要錯過這一點免費已證明自己能夠實現盈利增長的公司名單。
請注意,本文引用的市場回報反映了目前在美國交易所交易的股票的市場加權平均回報。
對這篇文章有什麼反饋嗎?擔心內容嗎? 保持聯繫直接與我們聯繫。或者,也可以給編輯組發電子郵件,地址是implywallst.com。
本文由Simply Wall St.撰寫,具有概括性。我們僅使用不偏不倚的方法提供基於歷史數據和分析師預測的評論,我們的文章並不打算作為財務建議。它不構成買賣任何股票的建議,也沒有考慮你的目標或你的財務狀況。我們的目標是為您帶來由基本面數據驅動的長期重點分析。請注意,我們的分析可能不會將最新的對價格敏感的公司公告或定性材料考慮在內。Simply Wall St.對上述任何一隻股票都沒有持倉。
moomoo是Moomoo Technologies Inc.公司提供的金融資訊和交易應用程式。
在美國,moomoo上的投資產品和服務由Moomoo Financial Inc.提供,一家受美國證券交易委員會(SEC)監管的持牌主體。 Moomoo Financial Inc.是金融業監管局(FINRA)和證券投資者保護公司(SIPC)的成員。
在新加坡,moomoo上的投資產品和服務是通過Moomoo Financial Singapore Pte. Ltd.提供,該公司受新加坡金融管理局(MAS)監管(牌照號碼︰CMS101000) ,持有資本市場服務牌照 (CMS) ,持有財務顧問豁免(Exempt Financial Adviser)資質。本內容未經新加坡金融管理局的審查。
在澳大利亞,moomoo上的金融產品和服務是通過Futu Securities (Australia) Ltd提供,該公司是受澳大利亞證券和投資委員會(ASIC)監管的澳大利亞金融服務許可機構(AFSL No. 224663)。請閱讀並理解我們的《金融服務指南》、《條款與條件》、《隱私政策》和其他披露文件,這些文件可在我們的網站 https://www.moomoo.com/au中獲取。
在加拿大,透過moomoo應用程式提供的僅限訂單執行的券商服務由Moomoo Financial Canada Inc.提供,並受加拿大投資監管機構(CIRO)監管。
在馬來西亞,moomoo上的投資產品和服務是透過Moomoo Securities Malaysia Sdn. Bhd. 提供,該公司受馬來西亞證券監督委員會(SC)監管(牌照號碼︰eCMSL/A0397/2024) ,持有資本市場服務牌照 (CMSL) 。本內容未經馬來西亞證券監督委員會的審查。
Moomoo Technologies Inc., Moomoo Financial Inc., Moomoo Financial Singapore Pte. Ltd.,Futu Securities (Australia) Ltd, Moomoo Financial Canada Inc和Moomoo Securities Malaysia Sdn. Bhd., 是關聯公司。
風險及免責聲明
moomoo是Moomoo Technologies Inc.公司提供的金融資訊和交易應用程式。
在美國,moomoo上的投資產品和服務由Moomoo Financial Inc.提供,一家受美國證券交易委員會(SEC)監管的持牌主體。 Moomoo Financial Inc.是金融業監管局(FINRA)和證券投資者保護公司(SIPC)的成員。
在新加坡,moomoo上的投資產品和服務是通過Moomoo Financial Singapore Pte. Ltd.提供,該公司受新加坡金融管理局(MAS)監管(牌照號碼︰CMS101000) ,持有資本市場服務牌照 (CMS) ,持有財務顧問豁免(Exempt Financial Adviser)資質。本內容未經新加坡金融管理局的審查。
在澳大利亞,moomoo上的金融產品和服務是通過Futu Securities (Australia) Ltd提供,該公司是受澳大利亞證券和投資委員會(ASIC)監管的澳大利亞金融服務許可機構(AFSL No. 224663)。請閱讀並理解我們的《金融服務指南》、《條款與條件》、《隱私政策》和其他披露文件,這些文件可在我們的網站 https://www.moomoo.com/au中獲取。
在加拿大,透過moomoo應用程式提供的僅限訂單執行的券商服務由Moomoo Financial Canada Inc.提供,並受加拿大投資監管機構(CIRO)監管。
在馬來西亞,moomoo上的投資產品和服務是透過Moomoo Securities Malaysia Sdn. Bhd. 提供,該公司受馬來西亞證券監督委員會(SC)監管(牌照號碼︰eCMSL/A0397/2024) ,持有資本市場服務牌照 (CMSL) 。本內容未經馬來西亞證券監督委員會的審查。
Moomoo Technologies Inc., Moomoo Financial Inc., Moomoo Financial Singapore Pte. Ltd.,Futu Securities (Australia) Ltd, Moomoo Financial Canada Inc和Moomoo Securities Malaysia Sdn. Bhd., 是關聯公司。
- 分享到weixin
- 分享到qq
- 分享到facebook
- 分享到twitter
- 分享到微博
- 粘贴板
使用瀏覽器的分享功能,分享給你的好友吧