
-
市場
-
產品
-
資訊
-
Moo社區
-
課堂
-
查看更多
-
功能介紹
-
費用費用透明,無最低余額限制
投資選擇、功能介紹、費用相關信息由Moomoo Financial Inc.提供
- English
- 中文繁體
- 中文简体
- 深色
- 淺色
Some Investors May Be Worried About China Oriental Group's (HKG:581) Returns On Capital
Some Investors May Be Worried About China Oriental Group's (HKG:581) Returns On Capital
What are the early trends we should look for to identify a stock that could multiply in value over the long term? One common approach is to try and find a company with returns on capital employed (ROCE) that are increasing, in conjunction with a growing amount of capital employed. Put simply, these types of businesses are compounding machines, meaning they are continually reinvesting their earnings at ever-higher rates of return. Having said that, from a first glance at China Oriental Group (HKG:581) we aren't jumping out of our chairs at how returns are trending, but let's have a deeper look.
Understanding Return On Capital Employed (ROCE)
Just to clarify if you're unsure, ROCE is a metric for evaluating how much pre-tax income (in percentage terms) a company earns on the capital invested in its business. The formula for this calculation on China Oriental Group is:
Return on Capital Employed = Earnings Before Interest and Tax (EBIT) ÷ (Total Assets - Current Liabilities)
0.12 = CN¥3.0b ÷ (CN¥52b - CN¥27b) (Based on the trailing twelve months to December 2021).
Thus, China Oriental Group has an ROCE of 12%. In absolute terms, that's a pretty normal return, and it's somewhat close to the Metals and Mining industry average of 14%.
Check out our latest analysis for China Oriental Group
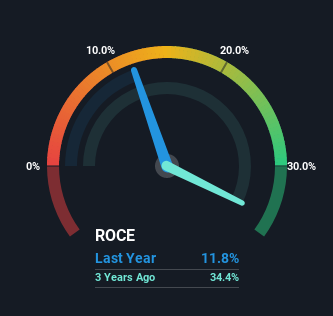 SEHK:581 Return on Capital Employed August 4th 2022
Above you can see how the current ROCE for China Oriental Group compares to its prior returns on capital, but there's only so much you can tell from the past. If you'd like to see what analysts are forecasting going forward, you should check out our free report for China Oriental Group.
What Does the ROCE Trend For China Oriental Group Tell Us?
In terms of China Oriental Group's historical ROCE movements, the trend isn't fantastic. Over the last five years, returns on capital have decreased to 12% from 18% five years ago. Although, given both revenue and the amount of assets employed in the business have increased, it could suggest the company is investing in growth, and the extra capital has led to a short-term reduction in ROCE. And if the increased capital generates additional returns, the business, and thus shareholders, will benefit in the long run.
On a separate but related note, it's important to know that China Oriental Group has a current liabilities to total assets ratio of 51%, which we'd consider pretty high. This effectively means that suppliers (or short-term creditors) are funding a large portion of the business, so just be aware that this can introduce some elements of risk. Ideally we'd like to see this reduce as that would mean fewer obligations bearing risks.
In Conclusion...
While returns have fallen for China Oriental Group in recent times, we're encouraged to see that sales are growing and that the business is reinvesting in its operations. However, despite the promising trends, the stock has fallen 46% over the last five years, so there might be an opportunity here for astute investors. As a result, we'd recommend researching this stock further to uncover what other fundamentals of the business can show us.
If you want to continue researching China Oriental Group, you might be interested to know about the 1 warning sign that our analysis has discovered.
For those who like to invest in solid companies, check out this free list of companies with solid balance sheets and high returns on equity.
Have feedback on this article? Concerned about the content? Get in touch with us directly. Alternatively, email editorial-team (at) simplywallst.com.
This article by Simply Wall St is general in nature. We provide commentary based on historical data and analyst forecasts only using an unbiased methodology and our articles are not intended to be financial advice. It does not constitute a recommendation to buy or sell any stock, and does not take account of your objectives, or your financial situation. We aim to bring you long-term focused analysis driven by fundamental data. Note that our analysis may not factor in the latest price-sensitive company announcements or qualitative material. Simply Wall St has no position in any stocks mentioned.
我們應該尋找哪些早期趨勢來識別一隻可能在長期內成倍增值的股票?一種常見的方法是嘗試找到一家擁有退貨已使用資本(ROCE)正在增加,同時也在增長金額已動用資本的比例。簡而言之,這些類型的企業是複利機器,這意味着它們不斷地以越來越高的回報率對收益進行再投資。話雖如此,從第一眼看中國東方集團(HKG:581)我們不會因為回報率的趨勢而從椅子上跳起來,但讓我們更深入地看看。
瞭解資本回報率(ROCE)
如果您不確定,只需澄清一下,ROCE是一種評估公司投資於其業務的資本獲得多少税前收入(按百分比計算)的指標。中國東方集團的這一計算公式為:
已動用資本回報率=息税前收益(EBIT)?(總資產-流動負債)
0.12=CN元3.0億?(CN元52B-CN元27B)(根據截至2021年12月的往績12個月計算).
因此,中國東方集團的淨資產收益率為12%。按絕對值計算,這是相當正常的回報率,有點接近金屬和礦業行業14%的平均水平。
查看我們對中國東方集團的最新分析
聯交所:581已動用資本回報率2022年8月4日上圖中,你可以看到中國東方集團目前的淨資產收益率與之前的資本回報率相比如何,但你只能從過去知道這麼多。如果您想查看分析師對未來的預測,您應該查看我們的免費為中國東方集團報道。
中國東方集團的ROCE趨勢告訴我們什麼?
就中國東方集團歷史上的ROCE運動而言,這一趨勢並不美妙。過去五年,資本回報率從五年前的18%降至12%。儘管,考慮到收入和業務中使用的資產數量都有所增加,這可能表明該公司正在投資於增長,而額外的資本導致了ROCE的短期下降。如果增加的資本產生額外的回報,從長遠來看,企業和股東都將受益。
在另一個相關的問題上,重要的是要知道,中國東方集團的流動負債與總資產之比為51%,我們認為這個比率相當高。這實際上意味着供應商(或短期債權人)正在為很大一部分業務提供資金,因此只需意識到這可能會帶來一些風險因素。理想情況下,我們希望看到這一比例降低,因為這將意味着承擔風險的債務更少。
總之..。
雖然最近中國東方集團的回報率有所下降,但我們感到鼓舞的是,銷售額在增長,該業務正在對其業務進行再投資。然而,儘管趨勢看好,但該股在過去五年中下跌了46%,因此精明的投資者可能會有機會。因此,我們建議進一步研究這隻股票,以揭示該業務的其他基本面可以向我們展示什麼。
如果你想繼續研究中國東方集團,你可能會有興趣瞭解一下1個警告標誌我們的分析發現。
對於那些喜歡投資於穩固的公司,看看這個免費資產負債表穩健、股本回報率高的公司名單。
對這篇文章有什麼反饋嗎?擔心內容嗎? 保持聯繫直接與我們聯繫。或者,也可以給編輯組發電子郵件,地址是implywallst.com。
本文由Simply Wall St.撰寫,具有概括性。我們僅使用不偏不倚的方法提供基於歷史數據和分析師預測的評論,我們的文章並不打算作為財務建議。它不構成買賣任何股票的建議,也沒有考慮你的目標或你的財務狀況。我們的目標是為您帶來由基本面數據驅動的長期重點分析。請注意,我們的分析可能不會將最新的對價格敏感的公司公告或定性材料考慮在內。Simply Wall St.對上述任何一隻股票都沒有持倉。
moomoo是Moomoo Technologies Inc.公司提供的金融資訊和交易應用程式。
在美國,moomoo上的投資產品和服務由Moomoo Financial Inc.提供,一家受美國證券交易委員會(SEC)監管的持牌主體。 Moomoo Financial Inc.是金融業監管局(FINRA)和證券投資者保護公司(SIPC)的成員。
在新加坡,moomoo上的投資產品和服務是通過Moomoo Financial Singapore Pte. Ltd.提供,該公司受新加坡金融管理局(MAS)監管(牌照號碼︰CMS101000) ,持有資本市場服務牌照 (CMS) ,持有財務顧問豁免(Exempt Financial Adviser)資質。本內容未經新加坡金融管理局的審查。
在澳大利亞,moomoo上的金融產品和服務是通過Futu Securities (Australia) Ltd提供,該公司是受澳大利亞證券和投資委員會(ASIC)監管的澳大利亞金融服務許可機構(AFSL No. 224663)。請閱讀並理解我們的《金融服務指南》、《條款與條件》、《隱私政策》和其他披露文件,這些文件可在我們的網站 https://www.moomoo.com/au中獲取。
在加拿大,透過moomoo應用程式提供的僅限訂單執行的券商服務由Moomoo Financial Canada Inc.提供,並受加拿大投資監管機構(CIRO)監管。
在馬來西亞,moomoo上的投資產品和服務是透過Moomoo Securities Malaysia Sdn. Bhd. 提供,該公司受馬來西亞證券監督委員會(SC)監管(牌照號碼︰eCMSL/A0397/2024) ,持有資本市場服務牌照 (CMSL) 。本內容未經馬來西亞證券監督委員會的審查。
Moomoo Technologies Inc., Moomoo Financial Inc., Moomoo Financial Singapore Pte. Ltd.,Futu Securities (Australia) Ltd, Moomoo Financial Canada Inc和Moomoo Securities Malaysia Sdn. Bhd., 是關聯公司。
風險及免責聲明
moomoo是Moomoo Technologies Inc.公司提供的金融資訊和交易應用程式。
在美國,moomoo上的投資產品和服務由Moomoo Financial Inc.提供,一家受美國證券交易委員會(SEC)監管的持牌主體。 Moomoo Financial Inc.是金融業監管局(FINRA)和證券投資者保護公司(SIPC)的成員。
在新加坡,moomoo上的投資產品和服務是通過Moomoo Financial Singapore Pte. Ltd.提供,該公司受新加坡金融管理局(MAS)監管(牌照號碼︰CMS101000) ,持有資本市場服務牌照 (CMS) ,持有財務顧問豁免(Exempt Financial Adviser)資質。本內容未經新加坡金融管理局的審查。
在澳大利亞,moomoo上的金融產品和服務是通過Futu Securities (Australia) Ltd提供,該公司是受澳大利亞證券和投資委員會(ASIC)監管的澳大利亞金融服務許可機構(AFSL No. 224663)。請閱讀並理解我們的《金融服務指南》、《條款與條件》、《隱私政策》和其他披露文件,這些文件可在我們的網站 https://www.moomoo.com/au中獲取。
在加拿大,透過moomoo應用程式提供的僅限訂單執行的券商服務由Moomoo Financial Canada Inc.提供,並受加拿大投資監管機構(CIRO)監管。
在馬來西亞,moomoo上的投資產品和服務是透過Moomoo Securities Malaysia Sdn. Bhd. 提供,該公司受馬來西亞證券監督委員會(SC)監管(牌照號碼︰eCMSL/A0397/2024) ,持有資本市場服務牌照 (CMSL) 。本內容未經馬來西亞證券監督委員會的審查。
Moomoo Technologies Inc., Moomoo Financial Inc., Moomoo Financial Singapore Pte. Ltd.,Futu Securities (Australia) Ltd, Moomoo Financial Canada Inc和Moomoo Securities Malaysia Sdn. Bhd., 是關聯公司。
- 分享到weixin
- 分享到qq
- 分享到facebook
- 分享到twitter
- 分享到微博
- 粘贴板
使用瀏覽器的分享功能,分享給你的好友吧