
-
市場
-
產品
-
資訊
-
Moo社區
-
課堂
-
查看更多
-
功能介紹
-
費用費用透明,無最低余額限制
投資選擇、功能介紹、費用相關信息由Moomoo Financial Inc.提供
- English
- 中文繁體
- 中文简体
- 深色
- 淺色
Calculating The Intrinsic Value Of Legend Holdings Corporation (HKG:3396)
Calculating The Intrinsic Value Of Legend Holdings Corporation (HKG:3396)
Today we'll do a simple run through of a valuation method used to estimate the attractiveness of Legend Holdings Corporation (HKG:3396) as an investment opportunity by projecting its future cash flows and then discounting them to today's value. One way to achieve this is by employing the Discounted Cash Flow (DCF) model. There's really not all that much to it, even though it might appear quite complex.
We generally believe that a company's value is the present value of all of the cash it will generate in the future. However, a DCF is just one valuation metric among many, and it is not without flaws. If you want to learn more about discounted cash flow, the rationale behind this calculation can be read in detail in the Simply Wall St analysis model.
Check out our latest analysis for Legend Holdings
Is Legend Holdings Fairly Valued?
We're using the 2-stage growth model, which simply means we take in account two stages of company's growth. In the initial period the company may have a higher growth rate and the second stage is usually assumed to have a stable growth rate. To begin with, we have to get estimates of the next ten years of cash flows. Seeing as no analyst estimates of free cash flow are available to us, we have extrapolate the previous free cash flow (FCF) from the company's last reported value. We assume companies with shrinking free cash flow will slow their rate of shrinkage, and that companies with growing free cash flow will see their growth rate slow, over this period. We do this to reflect that growth tends to slow more in the early years than it does in later years.
A DCF is all about the idea that a dollar in the future is less valuable than a dollar today, so we need to discount the sum of these future cash flows to arrive at a present value estimate:
10-year free cash flow (FCF) estimate
| 2023 | 2024 | 2025 | 2026 | 2027 | 2028 | 2029 | 2030 | 2031 | 2032 | |
| Levered FCF (CN¥, Millions) | CN¥5.11b | CN¥3.00b | CN¥2.15b | CN¥1.73b | CN¥1.51b | CN¥1.38b | CN¥1.30b | CN¥1.25b | CN¥1.23b | CN¥1.22b |
| Growth Rate Estimate Source | Est @ -59.53% | Est @ -41.2% | Est @ -28.38% | Est @ -19.4% | Est @ -13.11% | Est @ -8.72% | Est @ -5.64% | Est @ -3.48% | Est @ -1.97% | Est @ -0.91% |
| Present Value (CN¥, Millions) Discounted @ 11% | CN¥4.6k | CN¥2.4k | CN¥1.6k | CN¥1.1k | CN¥877 | CN¥718 | CN¥608 | CN¥527 | CN¥464 | CN¥412 |
("Est" = FCF growth rate estimated by Simply Wall St)
Present Value of 10-year Cash Flow (PVCF) = CN¥13b
The second stage is also known as Terminal Value, this is the business's cash flow after the first stage. For a number of reasons a very conservative growth rate is used that cannot exceed that of a country's GDP growth. In this case we have used the 5-year average of the 10-year government bond yield (1.6%) to estimate future growth. In the same way as with the 10-year 'growth' period, we discount future cash flows to today's value, using a cost of equity of 11%.
Terminal Value (TV)= FCF2032 × (1 + g) ÷ (r – g) = CN¥1.2b× (1 + 1.6%) ÷ (11%– 1.6%) = CN¥13b
Present Value of Terminal Value (PVTV)= TV / (1 + r)10= CN¥13b÷ ( 1 + 11%)10= CN¥4.2b
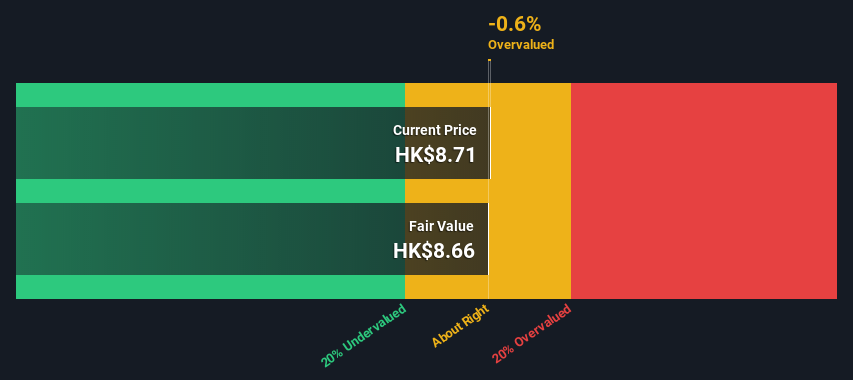
The total value is the sum of cash flows for the next ten years plus the discounted terminal value, which results in the Total Equity Value, which in this case is CN¥18b. In the final step we divide the equity value by the number of shares outstanding. Compared to the current share price of HK$8.7, the company appears around fair value at the time of writing. The assumptions in any calculation have a big impact on the valuation, so it is better to view this as a rough estimate, not precise down to the last cent.
 SEHK:3396 Discounted Cash Flow August 2nd 2022
Important Assumptions
The calculation above is very dependent on two assumptions. The first is the discount rate and the other is the cash flows. Part of investing is coming up with your own evaluation of a company's future performance, so try the calculation yourself and check your own assumptions. The DCF also does not consider the possible cyclicality of an industry, or a company's future capital requirements, so it does not give a full picture of a company's potential performance. Given that we are looking at Legend Holdings as potential shareholders, the cost of equity is used as the discount rate, rather than the cost of capital (or weighted average cost of capital, WACC) which accounts for debt. In this calculation we've used 11%, which is based on a levered beta of 2.000. Beta is a measure of a stock's volatility, compared to the market as a whole. We get our beta from the industry average beta of globally comparable companies, with an imposed limit between 0.8 and 2.0, which is a reasonable range for a stable business.
Next Steps:
Although the valuation of a company is important, it ideally won't be the sole piece of analysis you scrutinize for a company. DCF models are not the be-all and end-all of investment valuation. Rather it should be seen as a guide to "what assumptions need to be true for this stock to be under/overvalued?" If a company grows at a different rate, or if its cost of equity or risk free rate changes sharply, the output can look very different. For Legend Holdings, there are three further factors you should explore:
- Risks: Consider for instance, the ever-present spectre of investment risk. We've identified 2 warning signs with Legend Holdings (at least 1 which is concerning) , and understanding them should be part of your investment process.
- Future Earnings: How does 3396's growth rate compare to its peers and the wider market? Dig deeper into the analyst consensus number for the upcoming years by interacting with our free analyst growth expectation chart.
- Other Solid Businesses: Low debt, high returns on equity and good past performance are fundamental to a strong business. Why not explore our interactive list of stocks with solid business fundamentals to see if there are other companies you may not have considered!
PS. Simply Wall St updates its DCF calculation for every Hong Kong stock every day, so if you want to find the intrinsic value of any other stock just search here.
Have feedback on this article? Concerned about the content? Get in touch with us directly. Alternatively, email editorial-team (at) simplywallst.com.
This article by Simply Wall St is general in nature. We provide commentary based on historical data and analyst forecasts only using an unbiased methodology and our articles are not intended to be financial advice. It does not constitute a recommendation to buy or sell any stock, and does not take account of your objectives, or your financial situation. We aim to bring you long-term focused analysis driven by fundamental data. Note that our analysis may not factor in the latest price-sensitive company announcements or qualitative material. Simply Wall St has no position in any stocks mentioned.
今天,我們將簡單介紹一種估值方法,通過預測聯想控股公司(HKG:3396)未來的現金流並將其折現為今天的價值,來評估其作為投資機會的吸引力。實現這一點的一種方法是使用貼現現金流(DCF)模型。它真的沒有那麼多東西,儘管它可能看起來相當複雜。
我們通常認為,一家公司的價值是它未來將產生的所有現金的現值。然而,貼現現金流只是眾多估值指標中的一個,它也並非沒有缺陷。如果你想了解更多關於貼現現金流的信息,可以在Simply Wall St.分析模型中詳細閲讀這種計算背後的原理。
查看我們對聯想控股的最新分析
聯想控股的估值是否公平?
我們使用的是兩階段增長模型,也就是説,我們考慮了公司發展的兩個階段。在初期,公司可能有較高的增長率,而第二階段通常被假設為有一個穩定的增長率。首先,我們必須對未來十年的現金流進行估計。由於沒有分析師對自由現金流的估計,我們根據公司最近報告的價值推斷出了之前的自由現金流(FCF)。我們假設,自由現金流萎縮的公司將減緩收縮速度,而自由現金流增長的公司在這段時間內的增長速度將放緩。我們這樣做是為了反映出,增長在最初幾年往往比後來幾年放緩得更多。
貼現現金流就是這樣一種想法,即未來一美元的價值低於現在的一美元,因此我們需要對這些未來現金流的總和進行貼現,以得出現值估計:
10年自由現金流(FCF)估計
| 2023 | 2024 | 2025 | 2026 | 2027 | 2028 | 2029 | 2030 | 2031 | 2032 | |
| 槓桿FCF(CN元,百萬元) | CN元51.1億元 | CN人民幣3.0億元 | CN元21.5億元 | 淨額17.3億元 | 淨額15.1億元 | CN元13.8億元 | CN人民幣13.億元 | CN元12.5億元 | CN元12.3億元 | CN元12.2億元 |
| 增長率預估來源 | Est@-59.53% | Est@-41.2% | Est@-28.38% | Est@-19.4% | Est@-13.11% | Est@-8.72% | Est@-5.64% | Est@-3.48% | Est@-1.97% | Est@-0.91% |
| 現值(CN元,百萬)折現@11% | CN元4.6K | CN元2.4K | CN元1.6K元 | CN元1.1K | CN元877元 | CN元718元 | CN元608元 | CN元527元 | CN元464元 | CN元412元 |
(“EST”=Simply Wall St.預估的FCF成長率)
10年期現金流現值(PVCF)=CN元130億元
第二階段也被稱為終端價值,這是企業在第一階段之後的現金流。出於一些原因,使用了一個非常保守的增長率,不能超過一個國家的國內生產總值增長率。在這種情況下,我們使用了10年期政府債券收益率的5年平均值(1.6%)來估計未來的增長。與10年“增長”期一樣,我們使用11%的權益成本,將未來現金流貼現到今天的價值。
終端值(TV)=FCF2032×(1+g)?(r-g)=CN元1.2b×(1+1.6%)?(11%-1.6%)=CN元13b
終值現值(PVTV)=TV/(1+r)10=CN元130億?(1+11%)10=CN元42億元
總價值是未來十年的現金流總和加上貼現的終端價值,得出總權益價值,在本例中為人民幣180億元。在最後一步,我們用股本價值除以流通股的數量。與目前8.7港元的股價相比,該公司在撰寫本文時似乎接近公允價值。任何計算中的假設都會對估值產生很大影響,因此最好將其視為粗略估計,而不是精確到最後一分錢。
聯交所:3396貼現現金流2022年8月2日重要假設
上述計算在很大程度上取決於兩個假設。第一個是貼現率,另一個是現金流。投資的一部分是你自己對一家公司未來業績的評估,所以你自己試一試計算,檢查你自己的假設。DCF也沒有考慮一個行業可能的週期性,也沒有考慮一家公司未來的資本要求,因此它沒有給出一家公司潛在業績的全貌。鑑於我們將聯想控股視為潛在股東,股權成本被用作貼現率,而不是佔債務的資本成本(或加權平均資本成本,WACC)。在這個計算中,我們使用了11%,這是基於槓桿率為2.000的測試版。貝塔係數是衡量一隻股票相對於整個市場的波動性的指標。我們的貝塔係數來自全球可比公司的行業平均貝塔係數,強制限制在0.8到2.0之間,這是一個穩定業務的合理範圍。
接下來的步驟:
儘管一家公司的估值很重要,但理想情況下,它不會是你為一家公司仔細審查的唯一一項分析。貼現現金流模型並不是投資估值的全部。相反,它應該被視為“什麼假設需要成立才能讓這隻股票被低估或高估”的指南。如果一家公司以不同的速度增長,或者如果其股本成本或無風險利率大幅變化,產出可能看起來非常不同。對於聯想控股來説,還有三個因素值得你去探索:
- 風險例如,考慮一下一直存在的投資風險幽靈。我們已經確定了兩個警告信號與聯想控股(至少有一家是相關的),瞭解他們應該是你投資過程的一部分。
- 未來收益:3396的增長率與同行和更廣泛的市場相比如何?通過與我們的免費分析師增長預期圖表互動,更深入地挖掘分析師對未來幾年的共識數字。
- 其他穩固的企業:低債務、高股本回報率和良好的過去業績是強勁業務的基礎。為什麼不探索我們具有堅實商業基本面的股票的互動列表,看看是否有其他您可能沒有考慮過的公司!
PS.Simply Wall St.每天更新每隻香港股票的貼現現金流計算,所以如果你想找出任何其他股票的內在價值,只需搜索此處。
對這篇文章有什麼反饋嗎?擔心內容嗎? 保持聯繫直接與我們聯繫。或者,也可以給編輯組發電子郵件,地址是implywallst.com。
本文由Simply Wall St.撰寫,具有概括性。我們僅使用不偏不倚的方法提供基於歷史數據和分析師預測的評論,我們的文章並不打算作為財務建議。它不構成買賣任何股票的建議,也沒有考慮你的目標或你的財務狀況。我們的目標是為您帶來由基本面數據驅動的長期重點分析。請注意,我們的分析可能不會將最新的對價格敏感的公司公告或定性材料考慮在內。Simply Wall St.對上述任何一隻股票都沒有持倉。
moomoo是Moomoo Technologies Inc.公司提供的金融資訊和交易應用程式。
在美國,moomoo上的投資產品和服務由Moomoo Financial Inc.提供,一家受美國證券交易委員會(SEC)監管的持牌主體。 Moomoo Financial Inc.是金融業監管局(FINRA)和證券投資者保護公司(SIPC)的成員。
在新加坡,moomoo上的投資產品和服務是通過Moomoo Financial Singapore Pte. Ltd.提供,該公司受新加坡金融管理局(MAS)監管(牌照號碼︰CMS101000) ,持有資本市場服務牌照 (CMS) ,持有財務顧問豁免(Exempt Financial Adviser)資質。本內容未經新加坡金融管理局的審查。
在澳大利亞,moomoo上的金融產品和服務是通過Futu Securities (Australia) Ltd提供,該公司是受澳大利亞證券和投資委員會(ASIC)監管的澳大利亞金融服務許可機構(AFSL No. 224663)。請閱讀並理解我們的《金融服務指南》、《條款與條件》、《隱私政策》和其他披露文件,這些文件可在我們的網站 https://www.moomoo.com/au中獲取。
在加拿大,透過moomoo應用程式提供的僅限訂單執行的券商服務由Moomoo Financial Canada Inc.提供,並受加拿大投資監管機構(CIRO)監管。
在馬來西亞,moomoo上的投資產品和服務是透過Moomoo Securities Malaysia Sdn. Bhd. 提供,該公司受馬來西亞證券監督委員會(SC)監管(牌照號碼︰eCMSL/A0397/2024) ,持有資本市場服務牌照 (CMSL) 。本內容未經馬來西亞證券監督委員會的審查。
Moomoo Technologies Inc., Moomoo Financial Inc., Moomoo Financial Singapore Pte. Ltd.,Futu Securities (Australia) Ltd, Moomoo Financial Canada Inc和Moomoo Securities Malaysia Sdn. Bhd., 是關聯公司。
風險及免責聲明
moomoo是Moomoo Technologies Inc.公司提供的金融資訊和交易應用程式。
在美國,moomoo上的投資產品和服務由Moomoo Financial Inc.提供,一家受美國證券交易委員會(SEC)監管的持牌主體。 Moomoo Financial Inc.是金融業監管局(FINRA)和證券投資者保護公司(SIPC)的成員。
在新加坡,moomoo上的投資產品和服務是通過Moomoo Financial Singapore Pte. Ltd.提供,該公司受新加坡金融管理局(MAS)監管(牌照號碼︰CMS101000) ,持有資本市場服務牌照 (CMS) ,持有財務顧問豁免(Exempt Financial Adviser)資質。本內容未經新加坡金融管理局的審查。
在澳大利亞,moomoo上的金融產品和服務是通過Futu Securities (Australia) Ltd提供,該公司是受澳大利亞證券和投資委員會(ASIC)監管的澳大利亞金融服務許可機構(AFSL No. 224663)。請閱讀並理解我們的《金融服務指南》、《條款與條件》、《隱私政策》和其他披露文件,這些文件可在我們的網站 https://www.moomoo.com/au中獲取。
在加拿大,透過moomoo應用程式提供的僅限訂單執行的券商服務由Moomoo Financial Canada Inc.提供,並受加拿大投資監管機構(CIRO)監管。
在馬來西亞,moomoo上的投資產品和服務是透過Moomoo Securities Malaysia Sdn. Bhd. 提供,該公司受馬來西亞證券監督委員會(SC)監管(牌照號碼︰eCMSL/A0397/2024) ,持有資本市場服務牌照 (CMSL) 。本內容未經馬來西亞證券監督委員會的審查。
Moomoo Technologies Inc., Moomoo Financial Inc., Moomoo Financial Singapore Pte. Ltd.,Futu Securities (Australia) Ltd, Moomoo Financial Canada Inc和Moomoo Securities Malaysia Sdn. Bhd., 是關聯公司。
- 分享到weixin
- 分享到qq
- 分享到facebook
- 分享到twitter
- 分享到微博
- 粘贴板
使用瀏覽器的分享功能,分享給你的好友吧