
-
市場
-
產品
-
資訊
-
Moo社區
-
課堂
-
查看更多
-
功能介紹
-
費用費用透明,無最低余額限制
投資選擇、功能介紹、費用相關信息由Moomoo Financial Inc.提供
- English
- 中文繁體
- 中文简体
- 深色
- 淺色
Golden Energy and Resources' (SGX:AUE) 39% CAGR outpaced the company's earnings growth over the same three-year period
Golden Energy and Resources' (SGX:AUE) 39% CAGR outpaced the company's earnings growth over the same three-year period
Golden Energy and Resources Limited (SGX:AUE) shareholders might be concerned after seeing the share price drop 20% in the last quarter. In contrast, the return over three years has been impressive. Indeed, the share price is up a very strong 163% in that time. To some, the recent share price pullback wouldn't be surprising after such a good run. The fundamental business performance will ultimately dictate whether the top is in, or if this is a stellar buying opportunity.
On the back of a solid 7-day performance, let's check what role the company's fundamentals have played in driving long term shareholder returns.
Check out our latest analysis for Golden Energy and Resources
While the efficient markets hypothesis continues to be taught by some, it has been proven that markets are over-reactive dynamic systems, and investors are not always rational. One flawed but reasonable way to assess how sentiment around a company has changed is to compare the earnings per share (EPS) with the share price.
Golden Energy and Resources was able to grow its EPS at 37% per year over three years, sending the share price higher. This EPS growth is remarkably close to the 38% average annual increase in the share price. That suggests that the market sentiment around the company hasn't changed much over that time. Au contraire, the share price change has arguably mimicked the EPS growth.
You can see how EPS has changed over time in the image below (click on the chart to see the exact values).
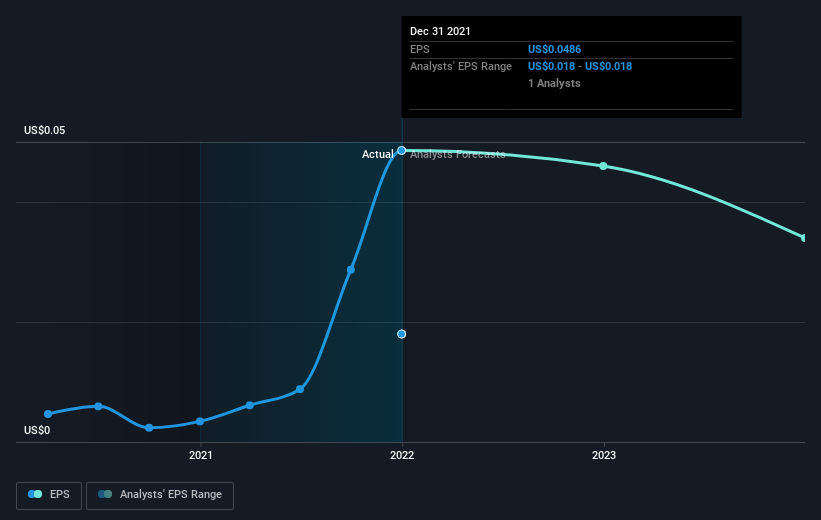 SGX:AUE Earnings Per Share Growth July 31st 2022
We know that Golden Energy and Resources has improved its bottom line over the last three years, but what does the future have in store? It might be well worthwhile taking a look at our free report on how its financial position has changed over time.
What About The Total Shareholder Return (TSR)?
We've already covered Golden Energy and Resources' share price action, but we should also mention its total shareholder return (TSR). Arguably the TSR is a more complete return calculation because it accounts for the value of dividends (as if they were reinvested), along with the hypothetical value of any discounted capital that have been offered to shareholders. Its history of dividend payouts mean that Golden Energy and Resources' TSR of 168% over the last 3 years is better than the share price return.
A Different Perspective
It's nice to see that Golden Energy and Resources shareholders have received a total shareholder return of 40% over the last year. Since the one-year TSR is better than the five-year TSR (the latter coming in at 9% per year), it would seem that the stock's performance has improved in recent times. Given the share price momentum remains strong, it might be worth taking a closer look at the stock, lest you miss an opportunity. It's always interesting to track share price performance over the longer term. But to understand Golden Energy and Resources better, we need to consider many other factors. Consider for instance, the ever-present spectre of investment risk. We've identified 3 warning signs with Golden Energy and Resources (at least 1 which shouldn't be ignored) , and understanding them should be part of your investment process.
Of course Golden Energy and Resources may not be the best stock to buy. So you may wish to see this free collection of growth stocks.
Please note, the market returns quoted in this article reflect the market weighted average returns of stocks that currently trade on SG exchanges.
Have feedback on this article? Concerned about the content? Get in touch with us directly. Alternatively, email editorial-team (at) simplywallst.com.
This article by Simply Wall St is general in nature. We provide commentary based on historical data and analyst forecasts only using an unbiased methodology and our articles are not intended to be financial advice. It does not constitute a recommendation to buy or sell any stock, and does not take account of your objectives, or your financial situation. We aim to bring you long-term focused analysis driven by fundamental data. Note that our analysis may not factor in the latest price-sensitive company announcements or qualitative material. Simply Wall St has no position in any stocks mentioned.
金色能源資源有限公司(新加坡證券交易所股票代碼:AU)股東在看到上個季度股價下跌20%後可能會感到擔憂。相比之下,三年來的回報令人印象深刻。事實上,在這段時間裏,該公司股價強勁上漲了163%。對一些人來説,在經歷瞭如此好的表現後,最近股價的回落並不令人意外。基本面的業務表現最終將決定頂層是否會進入,或者這是否是一個絕佳的買入機會。
在連續7天表現穩健的基礎上,讓我們來看看該公司的基本面在推動長期股東回報方面發揮了什麼作用。
查看我們對黃金能源和資源的最新分析
雖然有效市場假説繼續被一些人傳授,但事實證明,市場是過度反應的動態系統,投資者並不總是理性的。評估圍繞一家公司的情緒變化的一個有缺陷但合理的方法是將每股收益(EPS)與股價進行比較。
黃金能源和資源能夠在三年內以每年37%的速度增長每股收益,推動股價走高。這一每股收益的增長非常接近該公司股價年均38%的漲幅。這表明,在這段時間裏,圍繞該公司的市場情緒沒有太大變化。與之相反的是可以説,股價的變化模仿了每股收益的增長。
您可以在下圖中看到EPS是如何隨着時間的推移而變化的(單擊圖表可查看精確值)。
新交所:2022年7月31日每股收益增長我們知道,黃金能源和資源公司在過去三年裏提高了利潤,但未來會是什麼樣子呢?也許很值得一看我們的免費報告其財務狀況如何隨着時間的推移而發生變化。
那麼總股東回報(TSR)呢?
我們已經報道了Golden Energy and Resources的股價走勢,但我們還應該提到它的總股東回報(TSR)。可以説,TSR是一種更完整的回報計算方法,因為它計入了股息的價值(就像它們被再投資一樣),以及向股東提供的任何貼現資本的假設價值。它的派息歷史意味着,金色能源和資源公司過去3年168%的TSR好於股價回報。
不同的視角
很高興看到金色能源和資源公司的股東在過去一年中獲得了40%的總股東回報。由於一年期的TSR好於五年期的TSR(後者的年收益率為9%),看起來該股的表現在最近有所改善。鑑於股價勢頭依然強勁,仔細觀察這隻股票可能是值得的,以免錯過預期和機會。跟蹤股價的長期表現總是很有趣的。但為了更好地理解金色能源和資源,我們需要考慮許多其他因素。例如,考慮一下無處不在的投資風險幽靈。我們已經確定了三個警告信號與黃金能源和資源(至少1個不應被忽視),並瞭解他們應該是你投資過程的一部分。
當然了黃金能源和資源公司可能不是最值得購買的股票。所以你可能想看看這個免費成長型股票的集合。
請注意,本文引用的市場回報反映了目前在SG交易所交易的股票的市場加權平均回報。
對這篇文章有什麼反饋嗎?擔心內容嗎? 保持聯繫直接與我們聯繫。或者,也可以給編輯組發電子郵件,地址是implywallst.com。
本文由Simply Wall St.撰寫,具有概括性。我們僅使用不偏不倚的方法提供基於歷史數據和分析師預測的評論,我們的文章並不打算作為財務建議。它不構成買賣任何股票的建議,也沒有考慮你的目標或你的財務狀況。我們的目標是為您帶來由基本面數據驅動的長期重點分析。請注意,我們的分析可能不會將最新的對價格敏感的公司公告或定性材料考慮在內。Simply Wall St.對上述任何一隻股票都沒有持倉。
moomoo是Moomoo Technologies Inc.公司提供的金融資訊和交易應用程式。
在美國,moomoo上的投資產品和服務由Moomoo Financial Inc.提供,一家受美國證券交易委員會(SEC)監管的持牌主體。 Moomoo Financial Inc.是金融業監管局(FINRA)和證券投資者保護公司(SIPC)的成員。
在新加坡,moomoo上的投資產品和服務是通過Moomoo Financial Singapore Pte. Ltd.提供,該公司受新加坡金融管理局(MAS)監管(牌照號碼︰CMS101000) ,持有資本市場服務牌照 (CMS) ,持有財務顧問豁免(Exempt Financial Adviser)資質。本內容未經新加坡金融管理局的審查。
在澳大利亞,moomoo上的金融產品和服務是通過Futu Securities (Australia) Ltd提供,該公司是受澳大利亞證券和投資委員會(ASIC)監管的澳大利亞金融服務許可機構(AFSL No. 224663)。請閱讀並理解我們的《金融服務指南》、《條款與條件》、《隱私政策》和其他披露文件,這些文件可在我們的網站 https://www.moomoo.com/au中獲取。
在加拿大,透過moomoo應用程式提供的僅限訂單執行的券商服務由Moomoo Financial Canada Inc.提供,並受加拿大投資監管機構(CIRO)監管。
在馬來西亞,moomoo上的投資產品和服務是透過Moomoo Securities Malaysia Sdn. Bhd. 提供,該公司受馬來西亞證券監督委員會(SC)監管(牌照號碼︰eCMSL/A0397/2024) ,持有資本市場服務牌照 (CMSL) 。本內容未經馬來西亞證券監督委員會的審查。
Moomoo Technologies Inc., Moomoo Financial Inc., Moomoo Financial Singapore Pte. Ltd.,Futu Securities (Australia) Ltd, Moomoo Financial Canada Inc和Moomoo Securities Malaysia Sdn. Bhd., 是關聯公司。
風險及免責聲明
moomoo是Moomoo Technologies Inc.公司提供的金融資訊和交易應用程式。
在美國,moomoo上的投資產品和服務由Moomoo Financial Inc.提供,一家受美國證券交易委員會(SEC)監管的持牌主體。 Moomoo Financial Inc.是金融業監管局(FINRA)和證券投資者保護公司(SIPC)的成員。
在新加坡,moomoo上的投資產品和服務是通過Moomoo Financial Singapore Pte. Ltd.提供,該公司受新加坡金融管理局(MAS)監管(牌照號碼︰CMS101000) ,持有資本市場服務牌照 (CMS) ,持有財務顧問豁免(Exempt Financial Adviser)資質。本內容未經新加坡金融管理局的審查。
在澳大利亞,moomoo上的金融產品和服務是通過Futu Securities (Australia) Ltd提供,該公司是受澳大利亞證券和投資委員會(ASIC)監管的澳大利亞金融服務許可機構(AFSL No. 224663)。請閱讀並理解我們的《金融服務指南》、《條款與條件》、《隱私政策》和其他披露文件,這些文件可在我們的網站 https://www.moomoo.com/au中獲取。
在加拿大,透過moomoo應用程式提供的僅限訂單執行的券商服務由Moomoo Financial Canada Inc.提供,並受加拿大投資監管機構(CIRO)監管。
在馬來西亞,moomoo上的投資產品和服務是透過Moomoo Securities Malaysia Sdn. Bhd. 提供,該公司受馬來西亞證券監督委員會(SC)監管(牌照號碼︰eCMSL/A0397/2024) ,持有資本市場服務牌照 (CMSL) 。本內容未經馬來西亞證券監督委員會的審查。
Moomoo Technologies Inc., Moomoo Financial Inc., Moomoo Financial Singapore Pte. Ltd.,Futu Securities (Australia) Ltd, Moomoo Financial Canada Inc和Moomoo Securities Malaysia Sdn. Bhd., 是關聯公司。
- 分享到weixin
- 分享到qq
- 分享到facebook
- 分享到twitter
- 分享到微博
- 粘贴板
使用瀏覽器的分享功能,分享給你的好友吧