
-
市場
-
產品
-
資訊
-
Moo社區
-
課堂
-
查看更多
-
功能介紹
-
費用費用透明,無最低余額限制
投資選擇、功能介紹、費用相關信息由Moomoo Financial Inc.提供
- English
- 中文繁體
- 中文简体
- 深色
- 淺色
Is China East Education Holdings Limited's (HKG:667) Stock On A Downtrend As A Result Of Its Poor Financials?
Is China East Education Holdings Limited's (HKG:667) Stock On A Downtrend As A Result Of Its Poor Financials?
China East Education Holdings (HKG:667) has had a rough month with its share price down 23%. Given that stock prices are usually driven by a company's fundamentals over the long term, which in this case look pretty weak, we decided to study the company's key financial indicators. Specifically, we decided to study China East Education Holdings' ROE in this article.
Return on equity or ROE is an important factor to be considered by a shareholder because it tells them how effectively their capital is being reinvested. In other words, it is a profitability ratio which measures the rate of return on the capital provided by the company's shareholders.
View our latest analysis for China East Education Holdings
How Is ROE Calculated?
Return on equity can be calculated by using the formula:
Return on Equity = Net Profit (from continuing operations) ÷ Shareholders' Equity
So, based on the above formula, the ROE for China East Education Holdings is:
5.3% = CN¥302m ÷ CN¥5.7b (Based on the trailing twelve months to December 2021).
The 'return' is the amount earned after tax over the last twelve months. That means that for every HK$1 worth of shareholders' equity, the company generated HK$0.05 in profit.
What Is The Relationship Between ROE And Earnings Growth?
Thus far, we have learned that ROE measures how efficiently a company is generating its profits. We now need to evaluate how much profit the company reinvests or "retains" for future growth which then gives us an idea about the growth potential of the company. Assuming all else is equal, companies that have both a higher return on equity and higher profit retention are usually the ones that have a higher growth rate when compared to companies that don't have the same features.
A Side By Side comparison of China East Education Holdings' Earnings Growth And 5.3% ROE
At first glance, China East Education Holdings' ROE doesn't look very promising. A quick further study shows that the company's ROE doesn't compare favorably to the industry average of 11% either. Given the circumstances, the significant decline in net income by 16% seen by China East Education Holdings over the last five years is not surprising. We believe that there also might be other aspects that are negatively influencing the company's earnings prospects. For instance, the company has a very high payout ratio, or is faced with competitive pressures.
So, as a next step, we compared China East Education Holdings' performance against the industry and were disappointed to discover that while the company has been shrinking its earnings, the industry has been growing its earnings at a rate of 14% in the same period.
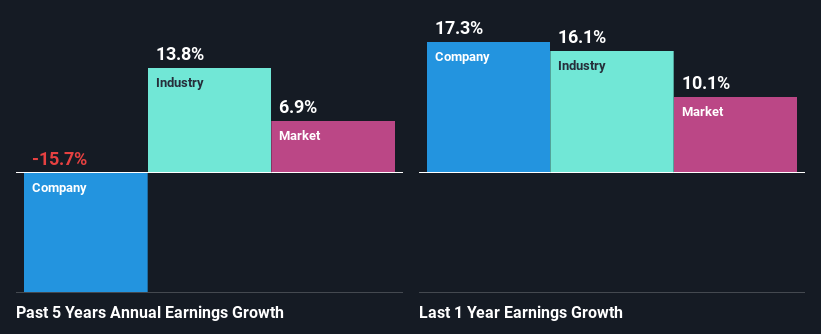 SEHK:667 Past Earnings Growth July 31st 2022
Earnings growth is a huge factor in stock valuation. What investors need to determine next is if the expected earnings growth, or the lack of it, is already built into the share price. Doing so will help them establish if the stock's future looks promising or ominous. One good indicator of expected earnings growth is the P/E ratio which determines the price the market is willing to pay for a stock based on its earnings prospects. So, you may want to check if China East Education Holdings is trading on a high P/E or a low P/E, relative to its industry.
Is China East Education Holdings Making Efficient Use Of Its Profits?
China East Education Holdings has a high three-year median payout ratio of 89% (that is, it is retaining 11% of its profits). This suggests that the company is paying most of its profits as dividends to its shareholders. This goes some way in explaining why its earnings have been shrinking. With only a little being reinvested into the business, earnings growth would obviously be low or non-existent. You can see the 2 risks we have identified for China East Education Holdings by visiting our risks dashboard for free on our platform here.
Additionally, China East Education Holdings started paying a dividend only recently. So it looks like the management may have perceived that shareholders favor dividends even though earnings have been in decline. Upon studying the latest analysts' consensus data, we found that the company's future payout ratio is expected to drop to 60% over the next three years. As a result, the expected drop in China East Education Holdings' payout ratio explains the anticipated rise in the company's future ROE to 12%, over the same period.
Summary
In total, we would have a hard think before deciding on any investment action concerning China East Education Holdings. The company has seen a lack of earnings growth as a result of retaining very little profits and whatever little it does retain, is being reinvested at a very low rate of return. With that said, we studied the latest analyst forecasts and found that while the company has shrunk its earnings in the past, analysts expect its earnings to grow in the future. To know more about the latest analysts predictions for the company, check out this visualization of analyst forecasts for the company.
Have feedback on this article? Concerned about the content? Get in touch with us directly. Alternatively, email editorial-team (at) simplywallst.com.
This article by Simply Wall St is general in nature. We provide commentary based on historical data and analyst forecasts only using an unbiased methodology and our articles are not intended to be financial advice. It does not constitute a recommendation to buy or sell any stock, and does not take account of your objectives, or your financial situation. We aim to bring you long-term focused analysis driven by fundamental data. Note that our analysis may not factor in the latest price-sensitive company announcements or qualitative material. Simply Wall St has no position in any stocks mentioned.
東方教育控股(HKG:667)經歷了艱難的一個月,其股價下跌了23%。鑑於股價通常是由一家公司的基本面長期驅動的,在這種情況下,基本面看起來相當疲軟,我們決定研究該公司的關鍵財務指標。具體地説,我們決定在本文中研究華東教育控股的淨資產收益率。
股本回報率或淨資產收益率是股東要考慮的一個重要因素,因為它告訴他們他們的資本再投資的效率。換句話説,這是一個衡量公司股東提供的資本回報率的盈利比率。
查看我們對華東教育控股的最新分析
淨資產收益率是如何計算的?
股本回報率可使用以下公式計算:
股本回報率=(持續經營的)淨利潤?股東權益
因此,根據上述公式,華東教育控股的淨資產收益率為:
5.3%=3.02億元×57億元(以截至2021年12月的12個月為基礎)。
“報税表”是過去12個月的税後收入。這意味着,每1港元的股東權益,該公司就會產生0.05港元的利潤。
淨資產收益率與盈利增長之間有什麼關係?
到目前為止,我們已經瞭解到淨資產收益率衡量的是一家公司創造利潤的效率。我們現在需要評估公司將多少利潤再投資或“保留”用於未來的增長,這就讓我們對公司的增長潛力有了一個瞭解。假設其他條件相同,與沒有相同特徵的公司相比,擁有更高股本回報率和更高利潤保留率的公司通常會有更高的增長率。
華東教育控股盈利增長與淨資產收益率5.3%的並列比較
乍一看,華東教育控股的淨資產收益率(ROE)看起來並不是很有希望。一項快速的進一步研究顯示,該公司的淨資產收益率(ROE)也不及11%的行業平均水平。在這種情況下,華東教育控股在過去五年中淨利潤大幅下降16%也就不足為奇了。我們認為,可能還有其他方面對公司的收益前景產生負面影響。例如,該公司的派息率非常高,或者面臨競爭壓力。
因此,作為下一步,我們將華東教育控股的表現與行業進行了比較,令人失望的是,儘管該公司的收益一直在縮水,但同期該行業的收益一直以14%的速度增長。
聯交所:667過去盈利增長2022年7月31日盈利增長是股票估值的一個重要因素。投資者下一步需要確定的是,預期的收益增長是否已經計入了股價。這樣做將有助於他們確定該股的未來看起來是光明的還是不祥的。衡量預期收益增長的一個很好的指標是市盈率,它根據一隻股票的盈利前景決定市場願意為其支付的價格。因此,你可能想看看華東教育控股相對於其所在行業的市盈率是高還是低。
華東教育控股是否在有效利用其利潤?
華東教育控股的三年中值派息率高達89%(也就是説,它保留了11%的利潤)。這表明該公司正在將大部分利潤作為股息支付給股東。這在一定程度上解釋了為什麼它的收益一直在縮水。由於只有一小部分再投資於該業務,盈利增長顯然會很低或根本不存在。您可以訪問我們的網站查看我們為華東教育控股確定的兩個風險風險控制面板在我們的平臺上是免費的。
此外,華東教育控股最近才開始派發股息。因此,看起來管理層可能已經意識到,儘管收益一直在下降,但股東們傾向於分紅。在研究了最新的分析師共識數據後,我們發現,該公司未來三年的派息率預計將降至60%。因此,華東教育控股公司派息率的預期下降解釋了同期該公司未來淨資產收益率預期上升至12%的原因。
摘要
總而言之,在決定對華東教育控股採取任何投資行動之前,我們都會三思而後行。由於保留了很少的利潤,該公司的收益增長乏力,而且無論它保留的是什麼,再投資的回報率都非常低。話雖如此,我們研究了最新的分析師預測,發現儘管該公司過去的收益有所縮水,但分析師預計其未來的收益將會增長。要了解更多分析師對該公司的最新預測,請查看分析師對該公司預測的可視化。
對這篇文章有什麼反饋嗎?擔心內容嗎? 保持聯繫直接與我們聯繫。或者,也可以給編輯組發電子郵件,地址是implywallst.com。
本文由Simply Wall St.撰寫,具有概括性。我們僅使用不偏不倚的方法提供基於歷史數據和分析師預測的評論,我們的文章並不打算作為財務建議。它不構成買賣任何股票的建議,也沒有考慮你的目標或你的財務狀況。我們的目標是為您帶來由基本面數據驅動的長期重點分析。請注意,我們的分析可能不會將最新的對價格敏感的公司公告或定性材料考慮在內。Simply Wall St.對上述任何一隻股票都沒有持倉。
moomoo是Moomoo Technologies Inc.公司提供的金融資訊和交易應用程式。
在美國,moomoo上的投資產品和服務由Moomoo Financial Inc.提供,一家受美國證券交易委員會(SEC)監管的持牌主體。 Moomoo Financial Inc.是金融業監管局(FINRA)和證券投資者保護公司(SIPC)的成員。
在新加坡,moomoo上的投資產品和服務是通過Moomoo Financial Singapore Pte. Ltd.提供,該公司受新加坡金融管理局(MAS)監管(牌照號碼︰CMS101000) ,持有資本市場服務牌照 (CMS) ,持有財務顧問豁免(Exempt Financial Adviser)資質。本內容未經新加坡金融管理局的審查。
在澳大利亞,moomoo上的金融產品和服務是通過Futu Securities (Australia) Ltd提供,該公司是受澳大利亞證券和投資委員會(ASIC)監管的澳大利亞金融服務許可機構(AFSL No. 224663)。請閱讀並理解我們的《金融服務指南》、《條款與條件》、《隱私政策》和其他披露文件,這些文件可在我們的網站 https://www.moomoo.com/au中獲取。
在加拿大,透過moomoo應用程式提供的僅限訂單執行的券商服務由Moomoo Financial Canada Inc.提供,並受加拿大投資監管機構(CIRO)監管。
在馬來西亞,moomoo上的投資產品和服務是透過Moomoo Securities Malaysia Sdn. Bhd. 提供,該公司受馬來西亞證券監督委員會(SC)監管(牌照號碼︰eCMSL/A0397/2024) ,持有資本市場服務牌照 (CMSL) 。本內容未經馬來西亞證券監督委員會的審查。
Moomoo Technologies Inc., Moomoo Financial Inc., Moomoo Financial Singapore Pte. Ltd.,Futu Securities (Australia) Ltd, Moomoo Financial Canada Inc和Moomoo Securities Malaysia Sdn. Bhd., 是關聯公司。
風險及免責聲明
moomoo是Moomoo Technologies Inc.公司提供的金融資訊和交易應用程式。
在美國,moomoo上的投資產品和服務由Moomoo Financial Inc.提供,一家受美國證券交易委員會(SEC)監管的持牌主體。 Moomoo Financial Inc.是金融業監管局(FINRA)和證券投資者保護公司(SIPC)的成員。
在新加坡,moomoo上的投資產品和服務是通過Moomoo Financial Singapore Pte. Ltd.提供,該公司受新加坡金融管理局(MAS)監管(牌照號碼︰CMS101000) ,持有資本市場服務牌照 (CMS) ,持有財務顧問豁免(Exempt Financial Adviser)資質。本內容未經新加坡金融管理局的審查。
在澳大利亞,moomoo上的金融產品和服務是通過Futu Securities (Australia) Ltd提供,該公司是受澳大利亞證券和投資委員會(ASIC)監管的澳大利亞金融服務許可機構(AFSL No. 224663)。請閱讀並理解我們的《金融服務指南》、《條款與條件》、《隱私政策》和其他披露文件,這些文件可在我們的網站 https://www.moomoo.com/au中獲取。
在加拿大,透過moomoo應用程式提供的僅限訂單執行的券商服務由Moomoo Financial Canada Inc.提供,並受加拿大投資監管機構(CIRO)監管。
在馬來西亞,moomoo上的投資產品和服務是透過Moomoo Securities Malaysia Sdn. Bhd. 提供,該公司受馬來西亞證券監督委員會(SC)監管(牌照號碼︰eCMSL/A0397/2024) ,持有資本市場服務牌照 (CMSL) 。本內容未經馬來西亞證券監督委員會的審查。
Moomoo Technologies Inc., Moomoo Financial Inc., Moomoo Financial Singapore Pte. Ltd.,Futu Securities (Australia) Ltd, Moomoo Financial Canada Inc和Moomoo Securities Malaysia Sdn. Bhd., 是關聯公司。
- 分享到weixin
- 分享到qq
- 分享到facebook
- 分享到twitter
- 分享到微博
- 粘贴板
使用瀏覽器的分享功能,分享給你的好友吧