
-
市場
-
產品
-
資訊
-
Moo社區
-
課堂
-
查看更多
-
功能介紹
-
費用費用透明,無最低余額限制
投資選擇、功能介紹、費用相關信息由Moomoo Financial Inc.提供
- English
- 中文繁體
- 中文简体
- 深色
- 淺色
Nine Dragons Paper (Holdings) Limited (HKG:2689) Shares Could Be 50% Below Their Intrinsic Value Estimate
Nine Dragons Paper (Holdings) Limited (HKG:2689) Shares Could Be 50% Below Their Intrinsic Value Estimate
Does the July share price for Nine Dragons Paper (Holdings) Limited (HKG:2689) reflect what it's really worth? Today, we will estimate the stock's intrinsic value by estimating the company's future cash flows and discounting them to their present value. We will take advantage of the Discounted Cash Flow (DCF) model for this purpose. Believe it or not, it's not too difficult to follow, as you'll see from our example!
Companies can be valued in a lot of ways, so we would point out that a DCF is not perfect for every situation. For those who are keen learners of equity analysis, the Simply Wall St analysis model here may be something of interest to you.
View our latest analysis for Nine Dragons Paper (Holdings)
What's The Estimated Valuation?
We use what is known as a 2-stage model, which simply means we have two different periods of growth rates for the company's cash flows. Generally the first stage is higher growth, and the second stage is a lower growth phase. To begin with, we have to get estimates of the next ten years of cash flows. Where possible we use analyst estimates, but when these aren't available we extrapolate the previous free cash flow (FCF) from the last estimate or reported value. We assume companies with shrinking free cash flow will slow their rate of shrinkage, and that companies with growing free cash flow will see their growth rate slow, over this period. We do this to reflect that growth tends to slow more in the early years than it does in later years.
A DCF is all about the idea that a dollar in the future is less valuable than a dollar today, so we discount the value of these future cash flows to their estimated value in today's dollars:
10-year free cash flow (FCF) forecast
| 2023 | 2024 | 2025 | 2026 | 2027 | 2028 | 2029 | 2030 | 2031 | 2032 | |
| Levered FCF (CN¥, Millions) | CN¥6.29b | CN¥5.86b | CN¥5.63b | CN¥5.49b | CN¥5.43b | CN¥5.40b | CN¥5.42b | CN¥5.45b | CN¥5.50b | CN¥5.56b |
| Growth Rate Estimate Source | Analyst x2 | Analyst x3 | Est @ -4.07% | Est @ -2.38% | Est @ -1.2% | Est @ -0.38% | Est @ 0.2% | Est @ 0.61% | Est @ 0.89% | Est @ 1.09% |
| Present Value (CN¥, Millions) Discounted @ 11% | CN¥5.6k | CN¥4.7k | CN¥4.1k | CN¥3.6k | CN¥3.2k | CN¥2.8k | CN¥2.5k | CN¥2.3k | CN¥2.1k | CN¥1.9k |
("Est" = FCF growth rate estimated by Simply Wall St)
Present Value of 10-year Cash Flow (PVCF) = CN¥33b
After calculating the present value of future cash flows in the initial 10-year period, we need to calculate the Terminal Value, which accounts for all future cash flows beyond the first stage. The Gordon Growth formula is used to calculate Terminal Value at a future annual growth rate equal to the 5-year average of the 10-year government bond yield of 1.6%. We discount the terminal cash flows to today's value at a cost of equity of 11%.
Terminal Value (TV)= FCF2032 × (1 + g) ÷ (r – g) = CN¥5.6b× (1 + 1.6%) ÷ (11%– 1.6%) = CN¥57b
Present Value of Terminal Value (PVTV)= TV / (1 + r)10= CN¥57b÷ ( 1 + 11%)10= CN¥19b
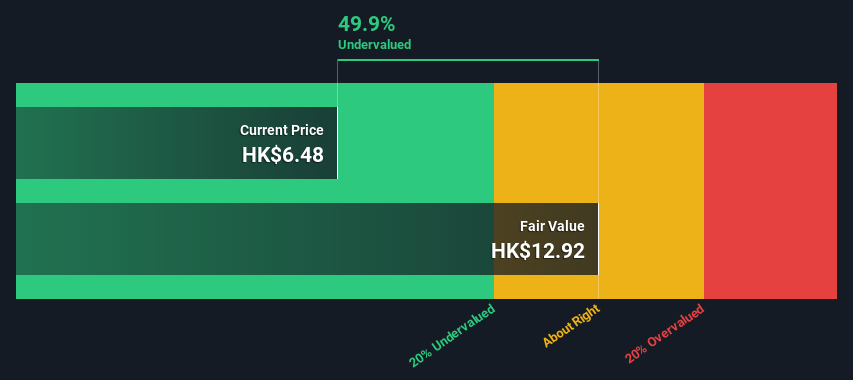
The total value, or equity value, is then the sum of the present value of the future cash flows, which in this case is CN¥52b. The last step is to then divide the equity value by the number of shares outstanding. Relative to the current share price of HK$6.5, the company appears quite good value at a 50% discount to where the stock price trades currently. The assumptions in any calculation have a big impact on the valuation, so it is better to view this as a rough estimate, not precise down to the last cent.
 SEHK:2689 Discounted Cash Flow July 29th 2022
Important Assumptions
The calculation above is very dependent on two assumptions. The first is the discount rate and the other is the cash flows. If you don't agree with these result, have a go at the calculation yourself and play with the assumptions. The DCF also does not consider the possible cyclicality of an industry, or a company's future capital requirements, so it does not give a full picture of a company's potential performance. Given that we are looking at Nine Dragons Paper (Holdings) as potential shareholders, the cost of equity is used as the discount rate, rather than the cost of capital (or weighted average cost of capital, WACC) which accounts for debt. In this calculation we've used 11%, which is based on a levered beta of 2.000. Beta is a measure of a stock's volatility, compared to the market as a whole. We get our beta from the industry average beta of globally comparable companies, with an imposed limit between 0.8 and 2.0, which is a reasonable range for a stable business.
Moving On:
Although the valuation of a company is important, it shouldn't be the only metric you look at when researching a company. It's not possible to obtain a foolproof valuation with a DCF model. Rather it should be seen as a guide to "what assumptions need to be true for this stock to be under/overvalued?" If a company grows at a different rate, or if its cost of equity or risk free rate changes sharply, the output can look very different. Can we work out why the company is trading at a discount to intrinsic value? For Nine Dragons Paper (Holdings), we've compiled three essential items you should look at:
- Risks: For instance, we've identified 2 warning signs for Nine Dragons Paper (Holdings) (1 is a bit concerning) you should be aware of.
- Future Earnings: How does 2689's growth rate compare to its peers and the wider market? Dig deeper into the analyst consensus number for the upcoming years by interacting with our free analyst growth expectation chart.
- Other High Quality Alternatives: Do you like a good all-rounder? Explore our interactive list of high quality stocks to get an idea of what else is out there you may be missing!
PS. The Simply Wall St app conducts a discounted cash flow valuation for every stock on the SEHK every day. If you want to find the calculation for other stocks just search here.
Have feedback on this article? Concerned about the content? Get in touch with us directly. Alternatively, email editorial-team (at) simplywallst.com.
This article by Simply Wall St is general in nature. We provide commentary based on historical data and analyst forecasts only using an unbiased methodology and our articles are not intended to be financial advice. It does not constitute a recommendation to buy or sell any stock, and does not take account of your objectives, or your financial situation. We aim to bring you long-term focused analysis driven by fundamental data. Note that our analysis may not factor in the latest price-sensitive company announcements or qualitative material. Simply Wall St has no position in any stocks mentioned.
玖龍紙業(集團)有限公司(HKG:2689)7月份的股價反映了它的真實價值嗎?今天,我們將通過估計公司未來的現金流並將其貼現到現值來估計股票的內在價值。為此,我們將利用貼現現金流(DCF)模型。信不信由你,遵循它並不太難,正如您將從我們的示例中看到的那樣!
對公司的估值可以有很多種方式,因此我們要指出,貼現現金流並不適用於每一種情況。對於那些熱衷於學習股票分析的人來説,這裏的Simply Wall St.分析模型可能會讓你感興趣。
查看我們對玖龍紙業(控股)的最新分析
估計的估價是多少?
我們使用所謂的兩階段模型,也就是説,公司的現金流有兩個不同的增長率。一般來説,第一階段是較高增長階段,第二階段是較低增長階段。首先,我們必須對未來十年的現金流進行估計。在可能的情況下,我們使用分析師的估計,但當這些估計不可用時,我們會根據上次估計或報告的價值推斷先前的自由現金流(FCF)。我們假設,自由現金流萎縮的公司將減緩收縮速度,而自由現金流增長的公司在這段時間內的增長速度將放緩。我們這樣做是為了反映出,增長在最初幾年往往比後來幾年放緩得更多。
貼現現金流就是這樣一種想法,即未來的一美元不如現在的一美元,所以我們將這些未來現金流的價值貼現到以今天的美元計算的估計價值:
10年自由現金流(FCF)預測
| 2023 | 2024 | 2025 | 2026 | 2027 | 2028 | 2029 | 2030 | 2031 | 2032 | |
| 槓桿FCF(CN元,百萬元) | CN元62.9億元 | CN元58.6億元 | CN元56.3億元 | CN元54.9億元 | CN元54.3億元 | CN元54億元 | CN元54.2億元 | CN元54.5億元 | CN元5.5億元 | CN元55.6億元 |
| 增長率預估來源 | 分析師x2 | 分析師x3 | Est@-4.07% | Est@-2.38% | Est@-1.2% | Est@-0.38% | EST@0.2% | Est@0.61% | Est@0.89% | Est@1.09% |
| 現值(CN元,百萬)折現@11% | CN元5.6K | CN元4.7K | CN元4.1K | CN元3.6萬元 | CN元3.2K | CN元2.8K | CN元2.5K | CN元2.3K元 | CN元2.1K | CN元1.9萬元 |
(“EST”=Simply Wall St.預估的FCF成長率)
10年期現金流現值(PVCF)=CN元330億元
在計算了最初10年內未來現金流的現值後,我們需要計算終止值,它考慮了第一階段之後的所有未來現金流。戈登增長公式用於計算終端價值,其未來年增長率等於10年期政府債券收益率1.6%的5年平均水平。我們以11%的權益成本將終端現金流貼現到今天的價值。
終端值(TV)=FCF2032×(1+g)?(r-g)=CN元5.6b×(1+1.6%)?(11%-1.6%)=CN元57b
終值現值(PVTV)=TV/(1+r)10=CN元570億?(1+11%)10=CN元19億元
那麼,總價值或權益價值就是未來現金流的現值之和,在這種情況下,未來現金流的現值為52b元。最後一步是將股權價值除以流通股數量。相對於目前6.5港元的股價,該公司的價值似乎相當不錯,較目前的股價有50%的折讓。任何計算中的假設都會對估值產生很大影響,因此最好將其視為粗略估計,而不是精確到最後一分錢。
聯交所:2689貼現現金流2022年7月29日重要假設
上述計算在很大程度上取決於兩個假設。第一個是貼現率,另一個是現金流。如果你不同意這些結果,你可以自己試一試計算,並玩弄一下假設。DCF也沒有考慮一個行業可能的週期性,也沒有考慮一家公司未來的資本要求,因此它沒有給出一家公司潛在業績的全貌。鑑於我們將玖龍紙業(控股)視為潛在股東,股權成本被用作貼現率,而不是佔債務的資本成本(或加權平均資本成本,WACC)。在這個計算中,我們使用了11%,這是基於槓桿率為2.000的測試版。貝塔係數是衡量一隻股票相對於整個市場的波動性的指標。我們的貝塔係數來自全球可比公司的行業平均貝塔係數,強制限制在0.8到2.0之間,這是一個穩定業務的合理範圍。
下一步:
儘管一家公司的估值很重要,但它不應該是你在研究一家公司時唯一考慮的指標。用貼現現金流模型不可能獲得萬無一失的估值。相反,它應該被視為“什麼假設需要成立才能讓這隻股票被低估或高估”的指南。如果一家公司以不同的速度增長,或者如果其股本成本或無風險利率大幅變化,產出可能看起來非常不同。我們能弄清楚為什麼該公司的股價低於內在價值嗎?對於玖龍紙業(控股),我們整理了三個你應該看看的必備項目:
- 風險:例如,我們已經確定了玖龍紙業(控股)的2個警告標誌(1有點令人擔憂)你應該知道。
- 未來收益:2689的增長率與同行和更廣泛的市場相比如何?通過與我們的免費分析師增長預期圖表互動,更深入地挖掘分析師對未來幾年的共識數字。
- 其他高質量替代產品:你喜歡一個好的全能運動員嗎?瀏覽我們的高質量股票互動列表,瞭解您可能會錯過的其他股票!
PS.Simply Wall St.應用每天對聯交所的每隻股票進行現金流貼現估值。如果你想找到其他股票的計算方法,只需搜索此處。
對這篇文章有什麼反饋嗎?擔心內容嗎? 保持聯繫直接與我們聯繫。或者,也可以給編輯組發電子郵件,地址是implywallst.com。
本文由Simply Wall St.撰寫,具有概括性。我們僅使用不偏不倚的方法提供基於歷史數據和分析師預測的評論,我們的文章並不打算作為財務建議。它不構成買賣任何股票的建議,也沒有考慮你的目標或你的財務狀況。我們的目標是為您帶來由基本面數據驅動的長期重點分析。請注意,我們的分析可能不會將最新的對價格敏感的公司公告或定性材料考慮在內。Simply Wall St.對上述任何一隻股票都沒有持倉。
moomoo是Moomoo Technologies Inc.公司提供的金融資訊和交易應用程式。
在美國,moomoo上的投資產品和服務由Moomoo Financial Inc.提供,一家受美國證券交易委員會(SEC)監管的持牌主體。 Moomoo Financial Inc.是金融業監管局(FINRA)和證券投資者保護公司(SIPC)的成員。
在新加坡,moomoo上的投資產品和服務是通過Moomoo Financial Singapore Pte. Ltd.提供,該公司受新加坡金融管理局(MAS)監管(牌照號碼︰CMS101000) ,持有資本市場服務牌照 (CMS) ,持有財務顧問豁免(Exempt Financial Adviser)資質。本內容未經新加坡金融管理局的審查。
在澳大利亞,moomoo上的金融產品和服務是通過Futu Securities (Australia) Ltd提供,該公司是受澳大利亞證券和投資委員會(ASIC)監管的澳大利亞金融服務許可機構(AFSL No. 224663)。請閱讀並理解我們的《金融服務指南》、《條款與條件》、《隱私政策》和其他披露文件,這些文件可在我們的網站 https://www.moomoo.com/au中獲取。
在加拿大,透過moomoo應用程式提供的僅限訂單執行的券商服務由Moomoo Financial Canada Inc.提供,並受加拿大投資監管機構(CIRO)監管。
在馬來西亞,moomoo上的投資產品和服務是透過Moomoo Securities Malaysia Sdn. Bhd. 提供,該公司受馬來西亞證券監督委員會(SC)監管(牌照號碼︰eCMSL/A0397/2024) ,持有資本市場服務牌照 (CMSL) 。本內容未經馬來西亞證券監督委員會的審查。
Moomoo Technologies Inc., Moomoo Financial Inc., Moomoo Financial Singapore Pte. Ltd.,Futu Securities (Australia) Ltd, Moomoo Financial Canada Inc和Moomoo Securities Malaysia Sdn. Bhd., 是關聯公司。
風險及免責聲明
moomoo是Moomoo Technologies Inc.公司提供的金融資訊和交易應用程式。
在美國,moomoo上的投資產品和服務由Moomoo Financial Inc.提供,一家受美國證券交易委員會(SEC)監管的持牌主體。 Moomoo Financial Inc.是金融業監管局(FINRA)和證券投資者保護公司(SIPC)的成員。
在新加坡,moomoo上的投資產品和服務是通過Moomoo Financial Singapore Pte. Ltd.提供,該公司受新加坡金融管理局(MAS)監管(牌照號碼︰CMS101000) ,持有資本市場服務牌照 (CMS) ,持有財務顧問豁免(Exempt Financial Adviser)資質。本內容未經新加坡金融管理局的審查。
在澳大利亞,moomoo上的金融產品和服務是通過Futu Securities (Australia) Ltd提供,該公司是受澳大利亞證券和投資委員會(ASIC)監管的澳大利亞金融服務許可機構(AFSL No. 224663)。請閱讀並理解我們的《金融服務指南》、《條款與條件》、《隱私政策》和其他披露文件,這些文件可在我們的網站 https://www.moomoo.com/au中獲取。
在加拿大,透過moomoo應用程式提供的僅限訂單執行的券商服務由Moomoo Financial Canada Inc.提供,並受加拿大投資監管機構(CIRO)監管。
在馬來西亞,moomoo上的投資產品和服務是透過Moomoo Securities Malaysia Sdn. Bhd. 提供,該公司受馬來西亞證券監督委員會(SC)監管(牌照號碼︰eCMSL/A0397/2024) ,持有資本市場服務牌照 (CMSL) 。本內容未經馬來西亞證券監督委員會的審查。
Moomoo Technologies Inc., Moomoo Financial Inc., Moomoo Financial Singapore Pte. Ltd.,Futu Securities (Australia) Ltd, Moomoo Financial Canada Inc和Moomoo Securities Malaysia Sdn. Bhd., 是關聯公司。
- 分享到weixin
- 分享到qq
- 分享到facebook
- 分享到twitter
- 分享到微博
- 粘贴板
使用瀏覽器的分享功能,分享給你的好友吧