
-
市場
-
產品
-
資訊
-
Moo社區
-
課堂
-
查看更多
-
功能介紹
-
費用費用透明,無最低余額限制
投資選擇、功能介紹、費用相關信息由Moomoo Financial Inc.提供
- English
- 中文繁體
- 中文简体
- 深色
- 淺色
Redco Healthy Living Company Limited (HKG:2370) Stocks Pounded By 72% But Not Lagging Market On Growth Or Pricing
Redco Healthy Living Company Limited (HKG:2370) Stocks Pounded By 72% But Not Lagging Market On Growth Or Pricing
The Redco Healthy Living Company Limited (HKG:2370) share price has fared very poorly over the last month, falling by a substantial 72%. To make matters worse, the recent drop has wiped out a year's worth of gains with the share price now back where it started a year ago.
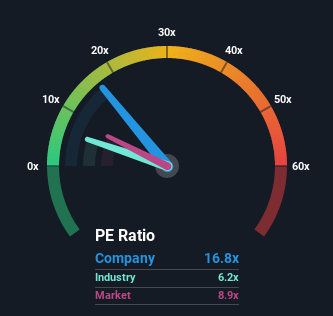
In spite of the heavy fall in price, Redco Healthy Living may still be sending very bearish signals at the moment with a price-to-earnings (or "P/E") ratio of 16.8x, since almost half of all companies in Hong Kong have P/E ratios under 8x and even P/E's lower than 5x are not unusual. However, the P/E might be quite high for a reason and it requires further investigation to determine if it's justified.
For example, consider that Redco Healthy Living's financial performance has been poor lately as it's earnings have been in decline. One possibility is that the P/E is high because investors think the company will still do enough to outperform the broader market in the near future. You'd really hope so, otherwise you're paying a pretty hefty price for no particular reason.
Check out our latest analysis for Redco Healthy Living
 SEHK:2370 Price Based on Past Earnings July 27th 2022 Want the full picture on earnings, revenue and cash flow for the company? Then our free report on Redco Healthy Living will help you shine a light on its historical performance.
 Is There Enough Growth For Redco Healthy Living?
Redco Healthy Living's P/E ratio would be typical for a company that's expected to deliver very strong growth, and importantly, perform much better than the market.
Taking a look back first, the company's earnings per share growth last year wasn't something to get excited about as it posted a disappointing decline of 19%. However, a few very strong years before that means that it was still able to grow EPS by an impressive 128% in total over the last three years. So we can start by confirming that the company has generally done a very good job of growing earnings over that time, even though it had some hiccups along the way.
Weighing that recent medium-term earnings trajectory against the broader market's one-year forecast for expansion of 15% shows it's noticeably more attractive on an annualised basis.
In light of this, it's understandable that Redco Healthy Living's P/E sits above the majority of other companies. Presumably shareholders aren't keen to offload something they believe will continue to outmanoeuvre the bourse.
The Key Takeaway
A significant share price dive has done very little to deflate Redco Healthy Living's very lofty P/E. Typically, we'd caution against reading too much into price-to-earnings ratios when settling on investment decisions, though it can reveal plenty about what other market participants think about the company.
As we suspected, our examination of Redco Healthy Living revealed its three-year earnings trends are contributing to its high P/E, given they look better than current market expectations. At this stage investors feel the potential for a deterioration in earnings isn't great enough to justify a lower P/E ratio. Unless the recent medium-term conditions change, they will continue to provide strong support to the share price.
Before you take the next step, you should know about the 3 warning signs for Redco Healthy Living (1 is significant!) that we have uncovered.
If P/E ratios interest you, you may wish to see this free collection of other companies that have grown earnings strongly and trade on P/E's below 20x.
Have feedback on this article? Concerned about the content? Get in touch with us directly. Alternatively, email editorial-team (at) simplywallst.com.
This article by Simply Wall St is general in nature. We provide commentary based on historical data and analyst forecasts only using an unbiased methodology and our articles are not intended to be financial advice. It does not constitute a recommendation to buy or sell any stock, and does not take account of your objectives, or your financial situation. We aim to bring you long-term focused analysis driven by fundamental data. Note that our analysis may not factor in the latest price-sensitive company announcements or qualitative material. Simply Wall St has no position in any stocks mentioned.
該 力高健康生活有限公司 (港股代號:2370) 股價在過去一個月表現非常差,跌幅大幅下跌 72%。更糟糕的是,最近的下跌已經消滅了一年的價值,現在的股價回到了一年前開始的地方。
儘管價格大幅下跌,Redco Healthy Living 在目前仍可能以 16.8x 的價格對收益比(或「P/E」)發出非常看跌的信號,因為香港幾乎一半的公司的市盈比率低於 8 倍,甚至 P/E 低於 5 倍也不尋常。但是,由於某種原因,P/E 可能相當高,需要進一步調查以確定是否合理。
例如,考慮到 Redco 健康生活的財務表現最近很差,因為它的收入一直在下降。一種可能性是市盈率很高,因為投資者認為該公司仍將在不久的將來做得足以超越更廣泛的市場。你真的希望如此, 否則你付出了相當高昂的代價沒有特別的原因.
查看我們關於 Redco 健康生活的最新分析
聯交所代碼:2370 價格根據過去盈利 2022 年 7 月 27 日想全面了解公司的盈利、收入和現金流量嗎?然後我們 自由 Redco 健康生活報告將幫助您了解其歷史表現。 紅高健康生活有足夠的增長嗎?
對於預計將實現非常強勁的增長的公司而言,Redco Healthy Living 的市盈率將是典型的,重要的是,表現比市場要好得多。
首先回顧一下,該公司去年的每股盈利增長並不令人興奮,因為它發布了 19% 的令人失望的下降。但是,在此之前的幾年非常強大,這意味著在過去三年中,它仍然能夠將每股盈餘增長 128% 令人印象深刻。因此,我們可以首先確認該公司通常在那段時間內完成了一項非常好的收入增長工作,儘管公司在此過程中遇到了一些打嗝。
將最近的中期盈利軌跡與更廣泛的市場對 15% 的一年預測相比,這顯示它在年度化基礎上明顯更具吸引力。
鑑於這一點,Redco 健康生活的 P/E 位於大多數其他公司之上是可以理解的。據推測,股東並不熱衷於卸載他們認為將繼續超越交易所的操作。
關鍵外賣
一個顯著的股價下跌對 Redco Healthy Living 非常崇高的市盈利壓力所做的很少,通常情況下,我們謹慎不要在結算投資決策時看到過多的價格與盈利比,儘管它可以揭示出很多其他市場參與者對公司的看法。
正如我們懷疑的那樣,我們對 Redco Healthy Living 的檢查顯示,由於它們看起來比當前市場預期要好,其三年期盈利趨勢正在促進其高市盈率趨勢。在這個階段,投資者認為盈利惡化的可能性不足以證明較低的市盈率是合理的。除非最近的中期情況發生變化,否則它們將繼續為股價提供強有力的支撐。
在您採取下一步之前,您應該了解 3 警告標誌為紅高健康生活 (1 是重要的!)我們已經發現了。
如果 P/E 比率利息你,你不妨看看這個 自由 收入強勁增長並在市盈率低於 20 倍交易的其他公司的集合。
對這篇文章有反饋嗎?關注內容? 取得聯繫 直接與我們聯繫。 或者,通過電子郵件發送電子郵件給編輯團隊。
這篇文章由簡單牆聖是一般性質. 我們僅使用公正的方法,根據歷史數據和分析師預測提供評論,我們的文章並不打算作為財務建議。 它並不構成購買或出售任何股票的建議,也不會考慮您的目標或您的財務狀況。我們的目標是為您帶來由基本數據驅動的長期集中分析。請注意,我們的分析可能不會考慮最新的價格敏感公司公告或定性材料。簡易華街在提及的任何股票中都沒有倉位。
moomoo是Moomoo Technologies Inc.公司提供的金融資訊和交易應用程式。
在美國,moomoo上的投資產品和服務由Moomoo Financial Inc.提供,一家受美國證券交易委員會(SEC)監管的持牌主體。 Moomoo Financial Inc.是金融業監管局(FINRA)和證券投資者保護公司(SIPC)的成員。
在新加坡,moomoo上的投資產品和服務是通過Moomoo Financial Singapore Pte. Ltd.提供,該公司受新加坡金融管理局(MAS)監管(牌照號碼︰CMS101000) ,持有資本市場服務牌照 (CMS) ,持有財務顧問豁免(Exempt Financial Adviser)資質。本內容未經新加坡金融管理局的審查。
在澳大利亞,moomoo上的金融產品和服務是通過Futu Securities (Australia) Ltd提供,該公司是受澳大利亞證券和投資委員會(ASIC)監管的澳大利亞金融服務許可機構(AFSL No. 224663)。請閱讀並理解我們的《金融服務指南》、《條款與條件》、《隱私政策》和其他披露文件,這些文件可在我們的網站 https://www.moomoo.com/au中獲取。
在加拿大,透過moomoo應用程式提供的僅限訂單執行的券商服務由Moomoo Financial Canada Inc.提供,並受加拿大投資監管機構(CIRO)監管。
在馬來西亞,moomoo上的投資產品和服務是透過Moomoo Securities Malaysia Sdn. Bhd. 提供,該公司受馬來西亞證券監督委員會(SC)監管(牌照號碼︰eCMSL/A0397/2024) ,持有資本市場服務牌照 (CMSL) 。本內容未經馬來西亞證券監督委員會的審查。
Moomoo Technologies Inc., Moomoo Financial Inc., Moomoo Financial Singapore Pte. Ltd.,Futu Securities (Australia) Ltd, Moomoo Financial Canada Inc和Moomoo Securities Malaysia Sdn. Bhd., 是關聯公司。
風險及免責聲明
moomoo是Moomoo Technologies Inc.公司提供的金融資訊和交易應用程式。
在美國,moomoo上的投資產品和服務由Moomoo Financial Inc.提供,一家受美國證券交易委員會(SEC)監管的持牌主體。 Moomoo Financial Inc.是金融業監管局(FINRA)和證券投資者保護公司(SIPC)的成員。
在新加坡,moomoo上的投資產品和服務是通過Moomoo Financial Singapore Pte. Ltd.提供,該公司受新加坡金融管理局(MAS)監管(牌照號碼︰CMS101000) ,持有資本市場服務牌照 (CMS) ,持有財務顧問豁免(Exempt Financial Adviser)資質。本內容未經新加坡金融管理局的審查。
在澳大利亞,moomoo上的金融產品和服務是通過Futu Securities (Australia) Ltd提供,該公司是受澳大利亞證券和投資委員會(ASIC)監管的澳大利亞金融服務許可機構(AFSL No. 224663)。請閱讀並理解我們的《金融服務指南》、《條款與條件》、《隱私政策》和其他披露文件,這些文件可在我們的網站 https://www.moomoo.com/au中獲取。
在加拿大,透過moomoo應用程式提供的僅限訂單執行的券商服務由Moomoo Financial Canada Inc.提供,並受加拿大投資監管機構(CIRO)監管。
在馬來西亞,moomoo上的投資產品和服務是透過Moomoo Securities Malaysia Sdn. Bhd. 提供,該公司受馬來西亞證券監督委員會(SC)監管(牌照號碼︰eCMSL/A0397/2024) ,持有資本市場服務牌照 (CMSL) 。本內容未經馬來西亞證券監督委員會的審查。
Moomoo Technologies Inc., Moomoo Financial Inc., Moomoo Financial Singapore Pte. Ltd.,Futu Securities (Australia) Ltd, Moomoo Financial Canada Inc和Moomoo Securities Malaysia Sdn. Bhd., 是關聯公司。
- 分享到weixin
- 分享到qq
- 分享到facebook
- 分享到twitter
- 分享到微博
- 粘贴板
使用瀏覽器的分享功能,分享給你的好友吧