
-
市場
-
產品
-
資訊
-
Moo社區
-
課堂
-
查看更多
-
功能介紹
-
費用費用透明,無最低余額限制
投資選擇、功能介紹、費用相關信息由Moomoo Financial Inc.提供
- English
- 中文繁體
- 中文简体
- 深色
- 淺色
Estimating The Intrinsic Value Of LifeTech Scientific Corporation (HKG:1302)
Estimating The Intrinsic Value Of LifeTech Scientific Corporation (HKG:1302)
How far off is LifeTech Scientific Corporation (HKG:1302) from its intrinsic value? Using the most recent financial data, we'll take a look at whether the stock is fairly priced by taking the forecast future cash flows of the company and discounting them back to today's value. We will take advantage of the Discounted Cash Flow (DCF) model for this purpose. Models like these may appear beyond the comprehension of a lay person, but they're fairly easy to follow.
We would caution that there are many ways of valuing a company and, like the DCF, each technique has advantages and disadvantages in certain scenarios. For those who are keen learners of equity analysis, the Simply Wall St analysis model here may be something of interest to you.
See our latest analysis for LifeTech Scientific
The calculation
We're using the 2-stage growth model, which simply means we take in account two stages of company's growth. In the initial period the company may have a higher growth rate and the second stage is usually assumed to have a stable growth rate. In the first stage we need to estimate the cash flows to the business over the next ten years. Seeing as no analyst estimates of free cash flow are available to us, we have extrapolate the previous free cash flow (FCF) from the company's last reported value. We assume companies with shrinking free cash flow will slow their rate of shrinkage, and that companies with growing free cash flow will see their growth rate slow, over this period. We do this to reflect that growth tends to slow more in the early years than it does in later years.
A DCF is all about the idea that a dollar in the future is less valuable than a dollar today, so we discount the value of these future cash flows to their estimated value in today's dollars:
10-year free cash flow (FCF) forecast
| 2023 | 2024 | 2025 | 2026 | 2027 | 2028 | 2029 | 2030 | 2031 | 2032 | |
| Levered FCF (CN¥, Millions) | CN¥290.3m | CN¥340.5m | CN¥383.3m | CN¥418.8m | CN¥447.9m | CN¥471.8m | CN¥491.5m | CN¥508.3m | CN¥522.7m | CN¥535.6m |
| Growth Rate Estimate Source | Est @ 24.04% | Est @ 17.29% | Est @ 12.57% | Est @ 9.26% | Est @ 6.95% | Est @ 5.33% | Est @ 4.2% | Est @ 3.4% | Est @ 2.85% | Est @ 2.46% |
| Present Value (CN¥, Millions) Discounted @ 6.0% | CN¥274 | CN¥303 | CN¥322 | CN¥332 | CN¥335 | CN¥333 | CN¥327 | CN¥319 | CN¥310 | CN¥300 |
("Est" = FCF growth rate estimated by Simply Wall St)
Present Value of 10-year Cash Flow (PVCF) = CN¥3.2b
After calculating the present value of future cash flows in the initial 10-year period, we need to calculate the Terminal Value, which accounts for all future cash flows beyond the first stage. For a number of reasons a very conservative growth rate is used that cannot exceed that of a country's GDP growth. In this case we have used the 5-year average of the 10-year government bond yield (1.6%) to estimate future growth. In the same way as with the 10-year 'growth' period, we discount future cash flows to today's value, using a cost of equity of 6.0%.
Terminal Value (TV)= FCF2032 × (1 + g) ÷ (r – g) = CN¥536m× (1 + 1.6%) ÷ (6.0%– 1.6%) = CN¥12b
Present Value of Terminal Value (PVTV)= TV / (1 + r)10= CN¥12b÷ ( 1 + 6.0%)10= CN¥6.9b
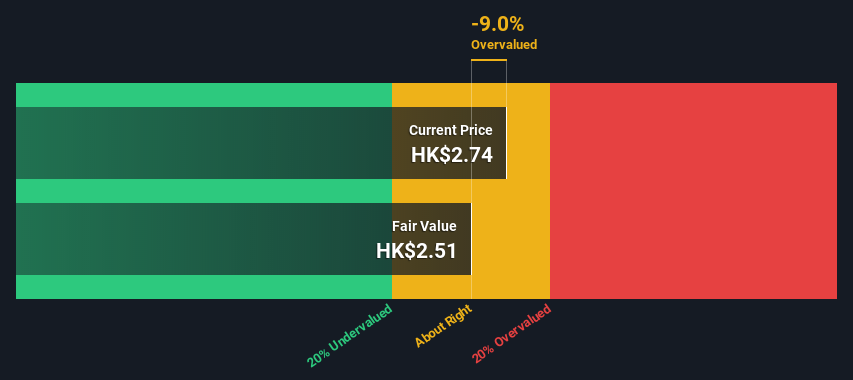
The total value, or equity value, is then the sum of the present value of the future cash flows, which in this case is CN¥10b. In the final step we divide the equity value by the number of shares outstanding. Relative to the current share price of HK$2.7, the company appears around fair value at the time of writing. The assumptions in any calculation have a big impact on the valuation, so it is better to view this as a rough estimate, not precise down to the last cent.
 SEHK:1302 Discounted Cash Flow July 15th 2022
Important assumptions
Now the most important inputs to a discounted cash flow are the discount rate, and of course, the actual cash flows. You don't have to agree with these inputs, I recommend redoing the calculations yourself and playing with them. The DCF also does not consider the possible cyclicality of an industry, or a company's future capital requirements, so it does not give a full picture of a company's potential performance. Given that we are looking at LifeTech Scientific as potential shareholders, the cost of equity is used as the discount rate, rather than the cost of capital (or weighted average cost of capital, WACC) which accounts for debt. In this calculation we've used 6.0%, which is based on a levered beta of 0.897. Beta is a measure of a stock's volatility, compared to the market as a whole. We get our beta from the industry average beta of globally comparable companies, with an imposed limit between 0.8 and 2.0, which is a reasonable range for a stable business.
Next Steps:
Although the valuation of a company is important, it is only one of many factors that you need to assess for a company. It's not possible to obtain a foolproof valuation with a DCF model. Preferably you'd apply different cases and assumptions and see how they would impact the company's valuation. For example, changes in the company's cost of equity or the risk free rate can significantly impact the valuation. For LifeTech Scientific, there are three further factors you should explore:
- Financial Health: Does 1302 have a healthy balance sheet? Take a look at our free balance sheet analysis with six simple checks on key factors like leverage and risk.
- Other High Quality Alternatives: Do you like a good all-rounder? Explore our interactive list of high quality stocks to get an idea of what else is out there you may be missing!
- Other Top Analyst Picks: Interested to see what the analysts are thinking? Take a look at our interactive list of analysts' top stock picks to find out what they feel might have an attractive future outlook!
PS. Simply Wall St updates its DCF calculation for every Hong Kong stock every day, so if you want to find the intrinsic value of any other stock just search here.
Have feedback on this article? Concerned about the content? Get in touch with us directly. Alternatively, email editorial-team (at) simplywallst.com.
This article by Simply Wall St is general in nature. We provide commentary based on historical data and analyst forecasts only using an unbiased methodology and our articles are not intended to be financial advice. It does not constitute a recommendation to buy or sell any stock, and does not take account of your objectives, or your financial situation. We aim to bring you long-term focused analysis driven by fundamental data. Note that our analysis may not factor in the latest price-sensitive company announcements or qualitative material. Simply Wall St has no position in any stocks mentioned.
生命科技公司(HKG: 1302)距離其內在價值還有多遠?使用最新的財務數據,我們將通過對公司未來現金流的預測並將其折現回今天的價值,來看看該股的定價是否合理。爲此,我們將利用折扣現金流(DCF)模型。像這樣的模型可能看起來超出了外行人的理解,但它們很容易理解。
我們要提醒的是,對公司進行估值的方法有很多,就像DCF一樣,每種技術在某些情況下都有優點和缺點。對於那些熱衷於股票分析的人來說,你可能會對這裏的Simply Wall St分析模型感興趣。
查看我們對生命科技的最新分析
計算
我們使用的是兩階段增長模型,這只是意味着我們考慮了公司增長的兩個階段。在初始階段,公司的增長率可能更高,而第二階段通常被認爲具有穩定的增長率。在第一階段,我們需要估算未來十年的業務現金流。鑑於我們沒有分析師對自由現金流的估計,我們從公司上次公佈的價值中推斷了之前的自由現金流(FCF)。我們假設自由現金流萎縮的公司將減緩其萎縮速度,而自由現金流不斷增長的公司在此期間的增長率將放緩。我們這樣做是爲了反映早期增長的放緩幅度往往比後來的幾年更大。
差價合約就是關於未來一美元的價值低於今天一美元的概念,因此我們將這些未來現金流的價值折現爲以今天的美元計算的估計價值:
10 年自由現金流 (FCF) 預測
| 2023 | 2024 | 2025 | 2026 | 2027 | 2028 | 2029 | 2030 | 2031 | 2032 | |
| 槓桿FCF(人民幣,百萬) | CN¥290.3m | CN¥3.405 | CN¥383.3 萬 | CN¥4188 | CN¥447.9 萬 | CN¥4718 萬 | CN¥491.5 萬 | CN¥508.3 | CN¥5227 萬 | CN¥5356 萬 |
| 增長率估算來源 | 美國東部時間 @ 24.04% | 美國東部標準時間 @ 17.29% | 美國東部標準時間 @ 12.57% | 美國東部標準時間 @ 9.26% | Est @ 6.95% | 美國東部時間 @ 5.33% | 美國東部時間 @ 4.2% | 美國東部時間 @ 3.4% | 東部時間 @ 2.85% | Est @ 2.46% |
| 現值(人民幣,百萬)折扣價 @ 6.0% | CN¥274 | CN¥303 | CN¥322 | CN¥332 | CN¥335 | CN¥333 | CN¥327 | CN¥319 | CN¥310 | CN¥300 |
(“Est” = Simply Wall St估計的FCF增長率)
10年期現金流(PVCF)的現值 = cn¥3.2b
在計算了最初10年期間未來現金流的現值之後,我們需要計算終端價值,該終端價值考慮了第一階段之後的所有未來現金流。出於多種原因,使用的增長率非常保守,不能超過一個國家的GDP增長率。在這種情況下,我們使用了10年期國債收益率的5年平均值(1.6%)來估計未來的增長。與10年的 “增長” 期相同,我們使用6.0%的股權成本,將未來的現金流折現爲今天的價值。
終端價值 (TV)= FCF2032 × (1 + g) ÷ (r — g) = cn¥536m× (1 + 1.6%) ÷ (6.0% — 1.6%) = cn¥12b
終端價值的現值 (PVTV)= 電視/ (1 + r)10= cn¥12b÷ (1 + 6.0%)10= cn¥69b
因此,總價值或權益價值是未來現金流現值的總和,在本例中爲100億元人民幣。在最後一步中,我們將權益價值除以已發行股票的數量。相對於目前的2.7港元股價,在撰寫本文時,該公司似乎處於公允價值附近。任何計算中的假設都會對估值產生重大影響,因此最好將其視爲粗略的估計,而不是精確到最後一美分。
SEHK: 1302 2022 年 7 月 15 日貼現現金流重要假設
現在,貼現現金流的最重要投入是貼現率,當然還有實際現金流。你不必同意這些輸入,我建議你自己重做計算然後試一試。DCF也沒有考慮一個行業可能的週期性,也沒有考慮公司未來的資本需求,因此它沒有全面描述公司的潛在表現。鑑於我們將LifeTech Scientific視爲潛在股東,因此使用股權成本作爲貼現率,而不是構成債務的資本成本(或加權平均資本成本,WACC)。在此計算中,我們使用了 6.0%,這是基於 0.897 的槓桿測試值。與整個市場相比,Beta是衡量股票波動率的指標。我們的測試值來自全球可比公司的行業平均測試值,施加的限制在0.8到2.0之間,對於穩定的業務而言,這是一個合理的範圍。
後續步驟:
儘管公司的估值很重要,但它只是公司需要評估的衆多因素之一。使用DCF模型不可能獲得萬無一失的估值。最好你應用不同的案例和假設,看看它們將如何影響公司的估值。例如,公司股本成本或無風險利率的變化可能會對估值產生重大影響。對於 LifeTech Scientific 來說,你還應該探索另外三個因素:
- 財務健康: 1302 的資產負債表健康嗎?看看我們的免費資產負債表分析,其中包含對槓桿率和風險等關鍵因素的六項簡單檢查。
- 其他高質量的替代品: 你喜歡一個優秀的全能選手嗎?瀏覽我們的高品質股票互動清單,瞭解您可能還缺少甚麼!
- 其他熱門分析師精選: 有興趣看看分析師在想甚麼嗎?看看我們的分析師首選股票的互動清單,瞭解他們認爲哪些股票的未來前景可能具有吸引力!
PS。Simply Wall St每天都會更新每隻香港股票的差價合約計算方法,因此,如果你想找到任何其他股票的內在價值,只需在這裏搜索即可。
對這篇文章有反饋嗎?對內容感到擔憂? 取得聯繫 直接和我們聯繫。 或者,給編輯團隊 (at) simplywallst.com 發送電子郵件。
Simply Wall St 的這篇文章本質上是一般性的。 我們僅使用公正的方法提供基於歷史數據和分析師預測的評論,我們的文章無意提供財務建議。 它不構成買入或賣出任何股票的建議,也沒有考慮您的目標或財務狀況。我們的目標是爲您提供由基本面數據驅動的長期重點分析。請注意,我們的分析可能未將最新的價格敏感型公司公告或定性材料考慮在內。簡而言之,華爾街對上述任何股票都沒有頭寸。
moomoo是Moomoo Technologies Inc.公司提供的金融資訊和交易應用程式。
在美國,moomoo上的投資產品和服務由Moomoo Financial Inc.提供,一家受美國證券交易委員會(SEC)監管的持牌主體。 Moomoo Financial Inc.是金融業監管局(FINRA)和證券投資者保護公司(SIPC)的成員。
在新加坡,moomoo上的投資產品和服務是通過Moomoo Financial Singapore Pte. Ltd.提供,該公司受新加坡金融管理局(MAS)監管(牌照號碼︰CMS101000) ,持有資本市場服務牌照 (CMS) ,持有財務顧問豁免(Exempt Financial Adviser)資質。本內容未經新加坡金融管理局的審查。
在澳大利亞,moomoo上的金融產品和服務是通過Futu Securities (Australia) Ltd提供,該公司是受澳大利亞證券和投資委員會(ASIC)監管的澳大利亞金融服務許可機構(AFSL No. 224663)。請閱讀並理解我們的《金融服務指南》、《條款與條件》、《隱私政策》和其他披露文件,這些文件可在我們的網站 https://www.moomoo.com/au中獲取。
在加拿大,透過moomoo應用程式提供的僅限訂單執行的券商服務由Moomoo Financial Canada Inc.提供,並受加拿大投資監管機構(CIRO)監管。
在馬來西亞,moomoo上的投資產品和服務是透過Moomoo Securities Malaysia Sdn. Bhd. 提供,該公司受馬來西亞證券監督委員會(SC)監管(牌照號碼︰eCMSL/A0397/2024) ,持有資本市場服務牌照 (CMSL) 。本內容未經馬來西亞證券監督委員會的審查。
Moomoo Technologies Inc., Moomoo Financial Inc., Moomoo Financial Singapore Pte. Ltd.,Futu Securities (Australia) Ltd, Moomoo Financial Canada Inc和Moomoo Securities Malaysia Sdn. Bhd., 是關聯公司。
風險及免責聲明
moomoo是Moomoo Technologies Inc.公司提供的金融資訊和交易應用程式。
在美國,moomoo上的投資產品和服務由Moomoo Financial Inc.提供,一家受美國證券交易委員會(SEC)監管的持牌主體。 Moomoo Financial Inc.是金融業監管局(FINRA)和證券投資者保護公司(SIPC)的成員。
在新加坡,moomoo上的投資產品和服務是通過Moomoo Financial Singapore Pte. Ltd.提供,該公司受新加坡金融管理局(MAS)監管(牌照號碼︰CMS101000) ,持有資本市場服務牌照 (CMS) ,持有財務顧問豁免(Exempt Financial Adviser)資質。本內容未經新加坡金融管理局的審查。
在澳大利亞,moomoo上的金融產品和服務是通過Futu Securities (Australia) Ltd提供,該公司是受澳大利亞證券和投資委員會(ASIC)監管的澳大利亞金融服務許可機構(AFSL No. 224663)。請閱讀並理解我們的《金融服務指南》、《條款與條件》、《隱私政策》和其他披露文件,這些文件可在我們的網站 https://www.moomoo.com/au中獲取。
在加拿大,透過moomoo應用程式提供的僅限訂單執行的券商服務由Moomoo Financial Canada Inc.提供,並受加拿大投資監管機構(CIRO)監管。
在馬來西亞,moomoo上的投資產品和服務是透過Moomoo Securities Malaysia Sdn. Bhd. 提供,該公司受馬來西亞證券監督委員會(SC)監管(牌照號碼︰eCMSL/A0397/2024) ,持有資本市場服務牌照 (CMSL) 。本內容未經馬來西亞證券監督委員會的審查。
Moomoo Technologies Inc., Moomoo Financial Inc., Moomoo Financial Singapore Pte. Ltd.,Futu Securities (Australia) Ltd, Moomoo Financial Canada Inc和Moomoo Securities Malaysia Sdn. Bhd., 是關聯公司。
- 分享到weixin
- 分享到qq
- 分享到facebook
- 分享到twitter
- 分享到微博
- 粘贴板
使用瀏覽器的分享功能,分享給你的好友吧