
-
市場
-
產品
-
資訊
-
Moo社區
-
課堂
-
查看更多
-
功能介紹
-
費用費用透明,無最低余額限制
投資選擇、功能介紹、費用相關信息由Moomoo Financial Inc.提供
- English
- 中文繁體
- 中文简体
- 深色
- 淺色
Investors in JD Health International (HKG:6618) have unfortunately lost 39% over the last year
Investors in JD Health International (HKG:6618) have unfortunately lost 39% over the last year
While it may not be enough for some shareholders, we think it is good to see the JD Health International Inc. (HKG:6618) share price up 22% in a single quarter. But in truth the last year hasn't been good for the share price. In fact, the price has declined 39% in a year, falling short of the returns you could get by investing in an index fund.
With that in mind, it's worth seeing if the company's underlying fundamentals have been the driver of long term performance, or if there are some discrepancies.
View our latest analysis for JD Health International
JD Health International wasn't profitable in the last twelve months, it is unlikely we'll see a strong correlation between its share price and its earnings per share (EPS). Arguably revenue is our next best option. Generally speaking, companies without profits are expected to grow revenue every year, and at a good clip. As you can imagine, fast revenue growth, when maintained, often leads to fast profit growth.
In the last year JD Health International saw its revenue grow by 58%. That's well above most other pre-profit companies. The share price drop of 39% over twelve months would be considered disappointing by many, so you might argue the company is getting little credit for its impressive revenue growth. On the bright side, if this company is moving profits in the right direction, top-line growth like that could be an opportunity. Our brains have evolved to think in linear fashion, so there's value in learning to recognize exponential growth. We are, in some ways, simply the wisest of the monkeys.
The image below shows how earnings and revenue have tracked over time (if you click on the image you can see greater detail).
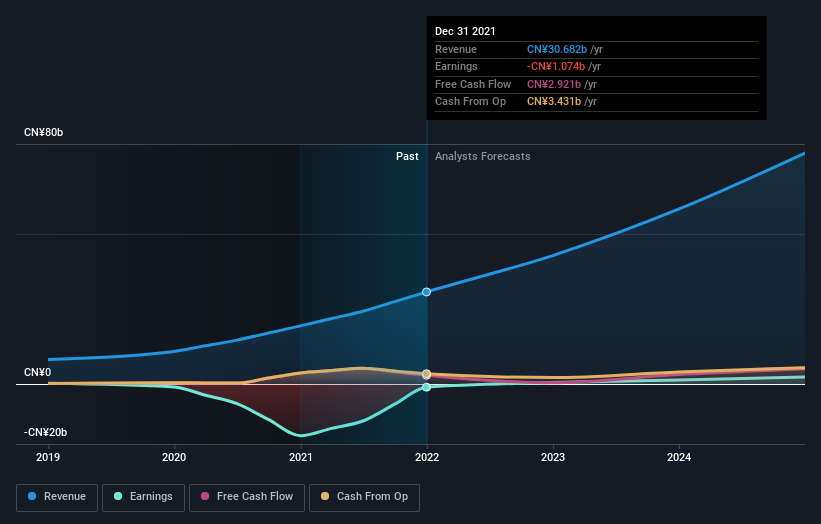 SEHK:6618 Earnings and Revenue Growth July 14th 2022
JD Health International is a well known stock, with plenty of analyst coverage, suggesting some visibility into future growth. So it makes a lot of sense to check out what analysts think JD Health International will earn in the future (free analyst consensus estimates)
A Different Perspective
JD Health International shareholders are down 39% for the year, even worse than the market loss of 20%. There's no doubt that's a disappointment, but the stock may well have fared better in a stronger market. It's great to see a nice little 22% rebound in the last three months. This could just be a bounce because the selling was too aggressive, but fingers crossed it's the start of a new trend. It's always interesting to track share price performance over the longer term. But to understand JD Health International better, we need to consider many other factors. To that end, you should be aware of the 2 warning signs we've spotted with JD Health International .
We will like JD Health International better if we see some big insider buys. While we wait, check out this free list of growing companies with considerable, recent, insider buying.
Please note, the market returns quoted in this article reflect the market weighted average returns of stocks that currently trade on HK exchanges.
Have feedback on this article? Concerned about the content? Get in touch with us directly. Alternatively, email editorial-team (at) simplywallst.com.
This article by Simply Wall St is general in nature. We provide commentary based on historical data and analyst forecasts only using an unbiased methodology and our articles are not intended to be financial advice. It does not constitute a recommendation to buy or sell any stock, and does not take account of your objectives, or your financial situation. We aim to bring you long-term focused analysis driven by fundamental data. Note that our analysis may not factor in the latest price-sensitive company announcements or qualitative material. Simply Wall St has no position in any stocks mentioned.
雖然這對一些股東來説可能還不夠,但我們認為看到京東健康國際有限公司。(HKG:6618)股價在一個季度內上漲22%。但事實上,過去一年對股價並不有利。事實上,金價在一年內下跌了39%,低於投資指數基金所能獲得的回報。
考慮到這一點,值得關注的是,該公司的潛在基本面是長期業績的驅動力,還是存在一些差異。
查看我們對京東健康國際的最新分析
京東健康國際在過去的12個月裏沒有盈利,我們不太可能看到它的股價和每股收益之間有很強的相關性。可以説,收入是我們的下一個最佳選擇。一般來説,沒有利潤的公司預計每年都會有收入增長,而且增長速度很快。正如你可以想象的那樣,快速的收入增長,如果保持下去,往往會帶來快速的利潤增長。
去年,京東健康國際的收入增長了58%。這遠遠高於其他大多數盈利前公司。股價在12個月內下跌39%會被許多人認為是令人失望的,所以你可能會説,該公司令人印象深刻的收入增長幾乎沒有得到什麼讚譽。好的一面是,如果這家公司將利潤轉移到正確的方向,那麼這樣的營收增長可能是一個機會。我們的大腦已經進化到以線性方式思考,所以學習識別指數增長是有價值的。在某些方面,我們簡直就是最聰明的猴子。
下圖顯示了收益和收入隨時間的變化情況(如果您點擊該圖,您可以看到更多詳細信息)。
聯交所:6618盈利及收入增長2022年7月14日京東健康國際是一隻知名的股票,有大量的分析師報道,這表明對未來的增長有一定的可見性。因此,看看分析師對京東健康國際未來收入的看法是很有意義的(自由分析師一致估計)
不同的視角
京東健康國際的股東今年以來下跌了39%,甚至比市場20%的跌幅還要糟糕。毫無疑問,這令人失望,但在一個更強勁的市場中,該股很可能表現得更好。很高興看到過去三個月出現了22%的小幅反彈。這可能只是一次反彈,因為拋售過於激進,但祈禱這是一種新趨勢的開始。跟蹤股價的長期表現總是很有趣的。但要更好地理解京東健康國際,我們還需要考慮許多其他因素。為此,您應該意識到2個警告標誌我們與京東健康國際公司進行了接觸。
如果我們看到一些大的內部收購,我們會更喜歡京東健康國際。在我們等待的時候,看看這個免費最近有大量內幕收購的成長型公司名單。
請注意,本文引用的市場回報反映了目前在香港交易所交易的股票的市場加權平均回報。
對這篇文章有什麼反饋嗎?擔心內容嗎? 保持聯繫直接與我們聯繫。或者,也可以給編輯組發電子郵件,地址是implywallst.com。
本文由Simply Wall St.撰寫,具有概括性。我們僅使用不偏不倚的方法提供基於歷史數據和分析師預測的評論,我們的文章並不打算作為財務建議。它不構成買賣任何股票的建議,也沒有考慮你的目標或你的財務狀況。我們的目標是為您帶來由基本面數據驅動的長期重點分析。請注意,我們的分析可能不會將最新的對價格敏感的公司公告或定性材料考慮在內。Simply Wall St.對上述任何一隻股票都沒有持倉。
moomoo是Moomoo Technologies Inc.公司提供的金融資訊和交易應用程式。
在美國,moomoo上的投資產品和服務由Moomoo Financial Inc.提供,一家受美國證券交易委員會(SEC)監管的持牌主體。 Moomoo Financial Inc.是金融業監管局(FINRA)和證券投資者保護公司(SIPC)的成員。
在新加坡,moomoo上的投資產品和服務是通過Moomoo Financial Singapore Pte. Ltd.提供,該公司受新加坡金融管理局(MAS)監管(牌照號碼︰CMS101000) ,持有資本市場服務牌照 (CMS) ,持有財務顧問豁免(Exempt Financial Adviser)資質。本內容未經新加坡金融管理局的審查。
在澳大利亞,moomoo上的金融產品和服務是通過Futu Securities (Australia) Ltd提供,該公司是受澳大利亞證券和投資委員會(ASIC)監管的澳大利亞金融服務許可機構(AFSL No. 224663)。請閱讀並理解我們的《金融服務指南》、《條款與條件》、《隱私政策》和其他披露文件,這些文件可在我們的網站 https://www.moomoo.com/au中獲取。
在加拿大,透過moomoo應用程式提供的僅限訂單執行的券商服務由Moomoo Financial Canada Inc.提供,並受加拿大投資監管機構(CIRO)監管。
在馬來西亞,moomoo上的投資產品和服務是透過Moomoo Securities Malaysia Sdn. Bhd. 提供,該公司受馬來西亞證券監督委員會(SC)監管(牌照號碼︰eCMSL/A0397/2024) ,持有資本市場服務牌照 (CMSL) 。本內容未經馬來西亞證券監督委員會的審查。
Moomoo Technologies Inc., Moomoo Financial Inc., Moomoo Financial Singapore Pte. Ltd.,Futu Securities (Australia) Ltd, Moomoo Financial Canada Inc和Moomoo Securities Malaysia Sdn. Bhd., 是關聯公司。
風險及免責聲明
moomoo是Moomoo Technologies Inc.公司提供的金融資訊和交易應用程式。
在美國,moomoo上的投資產品和服務由Moomoo Financial Inc.提供,一家受美國證券交易委員會(SEC)監管的持牌主體。 Moomoo Financial Inc.是金融業監管局(FINRA)和證券投資者保護公司(SIPC)的成員。
在新加坡,moomoo上的投資產品和服務是通過Moomoo Financial Singapore Pte. Ltd.提供,該公司受新加坡金融管理局(MAS)監管(牌照號碼︰CMS101000) ,持有資本市場服務牌照 (CMS) ,持有財務顧問豁免(Exempt Financial Adviser)資質。本內容未經新加坡金融管理局的審查。
在澳大利亞,moomoo上的金融產品和服務是通過Futu Securities (Australia) Ltd提供,該公司是受澳大利亞證券和投資委員會(ASIC)監管的澳大利亞金融服務許可機構(AFSL No. 224663)。請閱讀並理解我們的《金融服務指南》、《條款與條件》、《隱私政策》和其他披露文件,這些文件可在我們的網站 https://www.moomoo.com/au中獲取。
在加拿大,透過moomoo應用程式提供的僅限訂單執行的券商服務由Moomoo Financial Canada Inc.提供,並受加拿大投資監管機構(CIRO)監管。
在馬來西亞,moomoo上的投資產品和服務是透過Moomoo Securities Malaysia Sdn. Bhd. 提供,該公司受馬來西亞證券監督委員會(SC)監管(牌照號碼︰eCMSL/A0397/2024) ,持有資本市場服務牌照 (CMSL) 。本內容未經馬來西亞證券監督委員會的審查。
Moomoo Technologies Inc., Moomoo Financial Inc., Moomoo Financial Singapore Pte. Ltd.,Futu Securities (Australia) Ltd, Moomoo Financial Canada Inc和Moomoo Securities Malaysia Sdn. Bhd., 是關聯公司。
- 分享到weixin
- 分享到qq
- 分享到facebook
- 分享到twitter
- 分享到微博
- 粘贴板
使用瀏覽器的分享功能,分享給你的好友吧