
-
市場
-
產品
-
資訊
-
Moo社區
-
課堂
-
查看更多
-
功能介紹
-
費用費用透明,無最低余額限制
投資選擇、功能介紹、費用相關信息由Moomoo Financial Inc.提供
- English
- 中文繁體
- 中文简体
- 深色
- 淺色
The one-year underlying earnings growth at Sinofert Holdings (HKG:297) is promising, but the shareholders are still in the red over that time
The one-year underlying earnings growth at Sinofert Holdings (HKG:297) is promising, but the shareholders are still in the red over that time
Passive investing in an index fund is a good way to ensure your own returns roughly match the overall market. Active investors aim to buy stocks that vastly outperform the market - but in the process, they risk under-performance. That downside risk was realized by Sinofert Holdings Limited (HKG:297) shareholders over the last year, as the share price declined 29%. That falls noticeably short of the market decline of around 18%. On the other hand, the stock is actually up 14% over three years. The falls have accelerated recently, with the share price down 21% in the last three months.
After losing 5.4% this past week, it's worth investigating the company's fundamentals to see what we can infer from past performance.
Check out our latest analysis for Sinofert Holdings
There is no denying that markets are sometimes efficient, but prices do not always reflect underlying business performance. One imperfect but simple way to consider how the market perception of a company has shifted is to compare the change in the earnings per share (EPS) with the share price movement.
Even though the Sinofert Holdings share price is down over the year, its EPS actually improved. Of course, the situation might betray previous over-optimism about growth.
It's surprising to see the share price fall so much, despite the improved EPS. But we might find some different metrics explain the share price movements better.
Sinofert Holdings' dividend seems healthy to us, so we doubt that the yield is a concern for the market. From what we can see, revenue is pretty flat, so that doesn't really explain the share price drop. Unless, of course, the market was expecting a revenue uptick.
The graphic below depicts how earnings and revenue have changed over time (unveil the exact values by clicking on the image).
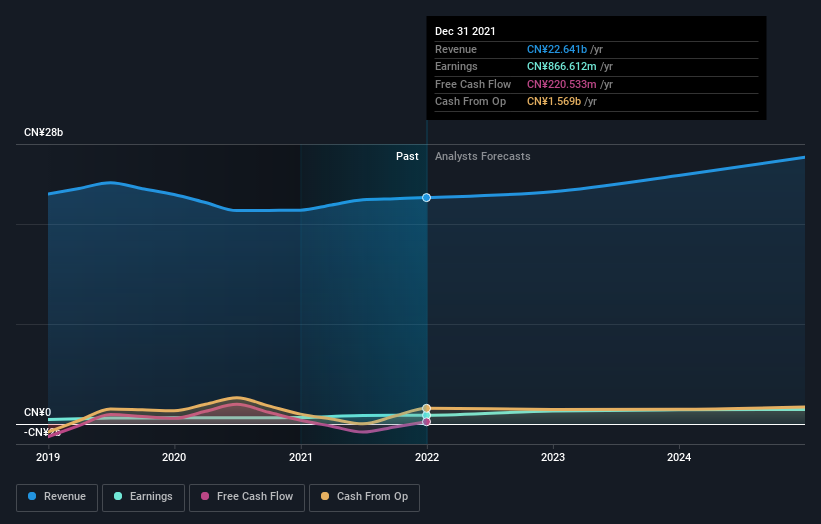 SEHK:297 Earnings and Revenue Growth July 12th 2022
We know that Sinofert Holdings has improved its bottom line lately, but what does the future have in store? If you are thinking of buying or selling Sinofert Holdings stock, you should check out this free report showing analyst profit forecasts.
What About Dividends?
As well as measuring the share price return, investors should also consider the total shareholder return (TSR). The TSR is a return calculation that accounts for the value of cash dividends (assuming that any dividend received was reinvested) and the calculated value of any discounted capital raisings and spin-offs. Arguably, the TSR gives a more comprehensive picture of the return generated by a stock. In the case of Sinofert Holdings, it has a TSR of -26% for the last 1 year. That exceeds its share price return that we previously mentioned. This is largely a result of its dividend payments!
A Different Perspective
We regret to report that Sinofert Holdings shareholders are down 26% for the year (even including dividends). Unfortunately, that's worse than the broader market decline of 18%. Having said that, it's inevitable that some stocks will be oversold in a falling market. The key is to keep your eyes on the fundamental developments. Longer term investors wouldn't be so upset, since they would have made 3%, each year, over five years. If the fundamental data continues to indicate long term sustainable growth, the current sell-off could be an opportunity worth considering. I find it very interesting to look at share price over the long term as a proxy for business performance. But to truly gain insight, we need to consider other information, too. Even so, be aware that Sinofert Holdings is showing 1 warning sign in our investment analysis , you should know about...
If you are like me, then you will not want to miss this free list of growing companies that insiders are buying.
Please note, the market returns quoted in this article reflect the market weighted average returns of stocks that currently trade on HK exchanges.
Have feedback on this article? Concerned about the content? Get in touch with us directly. Alternatively, email editorial-team (at) simplywallst.com.
This article by Simply Wall St is general in nature. We provide commentary based on historical data and analyst forecasts only using an unbiased methodology and our articles are not intended to be financial advice. It does not constitute a recommendation to buy or sell any stock, and does not take account of your objectives, or your financial situation. We aim to bring you long-term focused analysis driven by fundamental data. Note that our analysis may not factor in the latest price-sensitive company announcements or qualitative material. Simply Wall St has no position in any stocks mentioned.
被動投資指數基金是確保你自己的回報與整體市場大致匹配的好方法。積極投資者的目標是買入表現遠遠好於大盤的股票--但在這個過程中,他們面臨表現不佳的風險。這種下行風險通過以下方式實現中化集團有限公司(HKG:297)過去一年,隨着股價下跌29%,該公司股價下跌了29%。這明顯低於約18%的市場跌幅。另一方面,股票實際上是向上三年內增長14%。股價最近加速下跌,在過去三個月裏下跌了21%。
在過去一週下跌5.4%後,有必要調查一下該公司的基本面,看看我們可以從過去的表現中推斷出什麼。
查看我們對中化控股的最新分析
不可否認,市場有時是有效的,但價格並不總是反映潛在的商業表現。一種不完美但簡單的方法來考慮市場對一家公司的看法是如何改變的,那就是將每股收益(EPS)的變化與股價走勢進行比較。
儘管中化集團的股價在過去一年裏有所下降,但其每股收益實際上有所改善。當然,這種情況可能會暴露出之前對增長的過度樂觀。
令人驚訝的是,儘管每股收益有所改善,但股價卻下跌了這麼多。但我們可能會發現一些不同的衡量標準可以更好地解釋股價走勢。
中化控股的股息在我們看來似乎是健康的,因此我們懷疑收益率是否令市場擔憂。從我們看到的情況來看,營收相當持平,所以這並不能真正解釋股價下跌的原因。當然,除非市場預期收入會上升。
下圖描述了收益和收入隨時間的變化(通過單擊圖像來揭示確切的價值)。
聯交所:2022年7月12日盈利及收入增長297我們知道中化集團最近提高了利潤,但未來會是什麼樣子呢?如果你正在考慮購買或出售中化集團的股票,你應該看看這個免費顯示分析師利潤預測的報告。
那股息呢?
除了衡量股價回報外,投資者還應考慮總股東回報(TSR)。TSR是一種回報計算,計入了現金股息的價值(假設收到的任何股息都進行了再投資),以及任何貼現融資和剝離的計算價值。可以説,TSR更全面地描繪了一隻股票產生的回報。以中化控股為例,其最近一年的總資產收益率為-26%。這超過了我們之前提到的它的股價回報。這在很大程度上是其股息支付的結果!
不同的視角
我們遺憾地報告,中化控股的股東今年以來下降了26%(即使包括股息)。不幸的是,這比大盤18%的跌幅還要糟糕。話雖如此,在下跌的市場中,一些股票不可避免地會被超賣。關鍵是要密切關注基本面的發展。較長期的投資者不會如此沮喪,因為他們在五年內每年會獲得3%的收益。如果基本面數據繼續顯示長期可持續增長,當前的拋售可能是一個值得考慮的機會。我發現,把股價作為衡量企業業績的長期指標是非常有趣的。但為了真正獲得洞察力,我們還需要考慮其他信息。即便如此,請注意,中化控股正在展示在我們的投資分析中出現1個警告信號,你應該知道關於……
如果你像我一樣,你會的不想懷念這一切嗎?免費內部人士正在收購的成長型公司名單。
請注意,本文引用的市場回報反映了目前在香港交易所交易的股票的市場加權平均回報。
對這篇文章有什麼反饋嗎?擔心內容嗎? 保持聯繫直接與我們聯繫。或者,也可以給編輯組發電子郵件,地址是implywallst.com。
本文由Simply Wall St.撰寫,具有概括性。我們僅使用不偏不倚的方法提供基於歷史數據和分析師預測的評論,我們的文章並不打算作為財務建議。它不構成買賣任何股票的建議,也沒有考慮你的目標或你的財務狀況。我們的目標是為您帶來由基本面數據驅動的長期重點分析。請注意,我們的分析可能不會將最新的對價格敏感的公司公告或定性材料考慮在內。Simply Wall St.對上述任何一隻股票都沒有持倉。
moomoo是Moomoo Technologies Inc.公司提供的金融資訊和交易應用程式。
在美國,moomoo上的投資產品和服務由Moomoo Financial Inc.提供,一家受美國證券交易委員會(SEC)監管的持牌主體。 Moomoo Financial Inc.是金融業監管局(FINRA)和證券投資者保護公司(SIPC)的成員。
在新加坡,moomoo上的投資產品和服務是通過Moomoo Financial Singapore Pte. Ltd.提供,該公司受新加坡金融管理局(MAS)監管(牌照號碼︰CMS101000) ,持有資本市場服務牌照 (CMS) ,持有財務顧問豁免(Exempt Financial Adviser)資質。本內容未經新加坡金融管理局的審查。
在澳大利亞,moomoo上的金融產品和服務是通過Futu Securities (Australia) Ltd提供,該公司是受澳大利亞證券和投資委員會(ASIC)監管的澳大利亞金融服務許可機構(AFSL No. 224663)。請閱讀並理解我們的《金融服務指南》、《條款與條件》、《隱私政策》和其他披露文件,這些文件可在我們的網站 https://www.moomoo.com/au中獲取。
在加拿大,透過moomoo應用程式提供的僅限訂單執行的券商服務由Moomoo Financial Canada Inc.提供,並受加拿大投資監管機構(CIRO)監管。
在馬來西亞,moomoo上的投資產品和服務是透過Moomoo Securities Malaysia Sdn. Bhd. 提供,該公司受馬來西亞證券監督委員會(SC)監管(牌照號碼︰eCMSL/A0397/2024) ,持有資本市場服務牌照 (CMSL) 。本內容未經馬來西亞證券監督委員會的審查。
Moomoo Technologies Inc., Moomoo Financial Inc., Moomoo Financial Singapore Pte. Ltd.,Futu Securities (Australia) Ltd, Moomoo Financial Canada Inc和Moomoo Securities Malaysia Sdn. Bhd., 是關聯公司。
風險及免責聲明
moomoo是Moomoo Technologies Inc.公司提供的金融資訊和交易應用程式。
在美國,moomoo上的投資產品和服務由Moomoo Financial Inc.提供,一家受美國證券交易委員會(SEC)監管的持牌主體。 Moomoo Financial Inc.是金融業監管局(FINRA)和證券投資者保護公司(SIPC)的成員。
在新加坡,moomoo上的投資產品和服務是通過Moomoo Financial Singapore Pte. Ltd.提供,該公司受新加坡金融管理局(MAS)監管(牌照號碼︰CMS101000) ,持有資本市場服務牌照 (CMS) ,持有財務顧問豁免(Exempt Financial Adviser)資質。本內容未經新加坡金融管理局的審查。
在澳大利亞,moomoo上的金融產品和服務是通過Futu Securities (Australia) Ltd提供,該公司是受澳大利亞證券和投資委員會(ASIC)監管的澳大利亞金融服務許可機構(AFSL No. 224663)。請閱讀並理解我們的《金融服務指南》、《條款與條件》、《隱私政策》和其他披露文件,這些文件可在我們的網站 https://www.moomoo.com/au中獲取。
在加拿大,透過moomoo應用程式提供的僅限訂單執行的券商服務由Moomoo Financial Canada Inc.提供,並受加拿大投資監管機構(CIRO)監管。
在馬來西亞,moomoo上的投資產品和服務是透過Moomoo Securities Malaysia Sdn. Bhd. 提供,該公司受馬來西亞證券監督委員會(SC)監管(牌照號碼︰eCMSL/A0397/2024) ,持有資本市場服務牌照 (CMSL) 。本內容未經馬來西亞證券監督委員會的審查。
Moomoo Technologies Inc., Moomoo Financial Inc., Moomoo Financial Singapore Pte. Ltd.,Futu Securities (Australia) Ltd, Moomoo Financial Canada Inc和Moomoo Securities Malaysia Sdn. Bhd., 是關聯公司。
- 分享到weixin
- 分享到qq
- 分享到facebook
- 分享到twitter
- 分享到微博
- 粘贴板
使用瀏覽器的分享功能,分享給你的好友吧