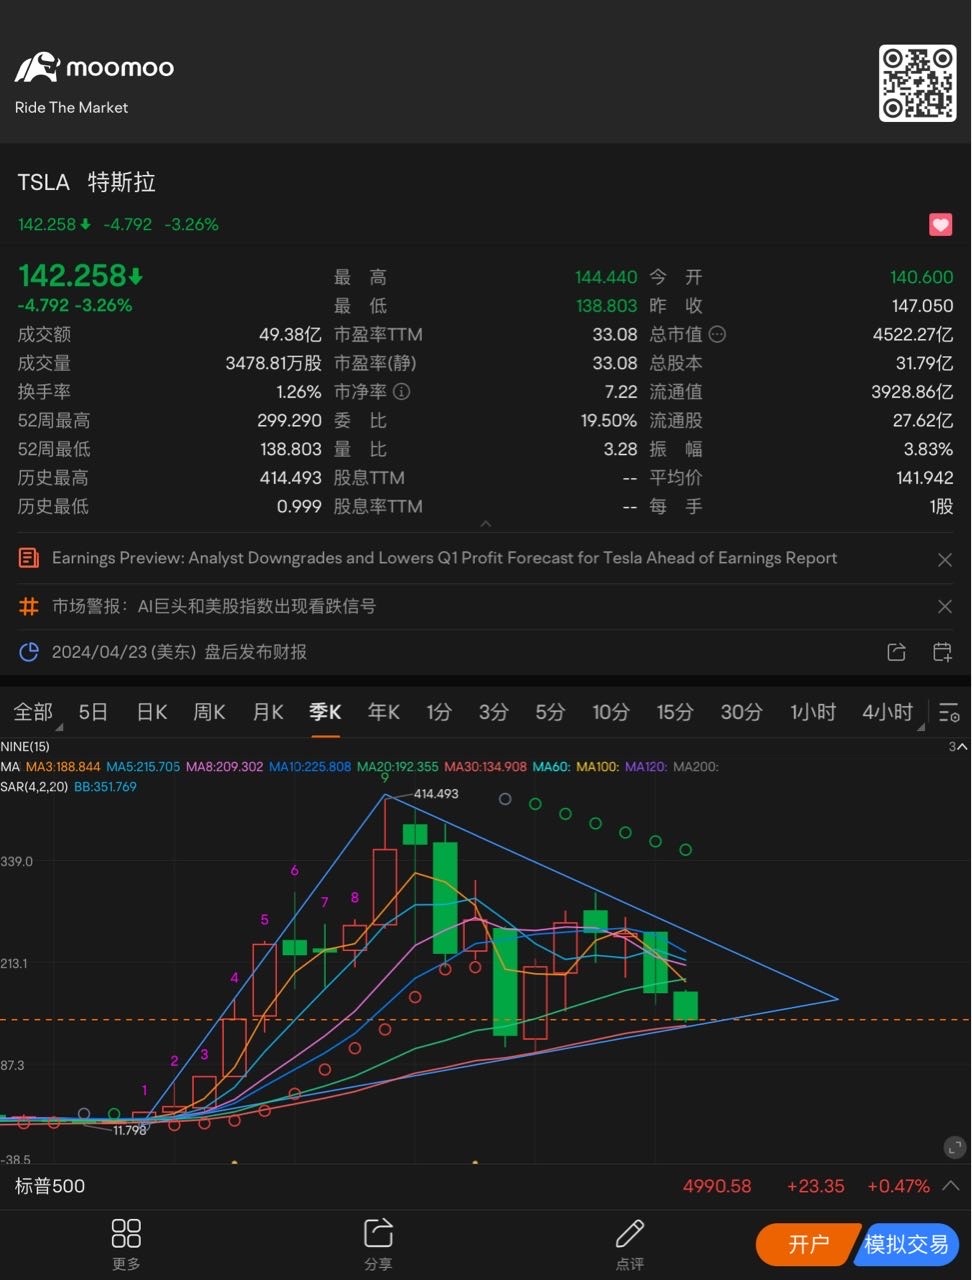
The K chart shows the triangular arrangement structure. Wait...
The K chart shows the triangular arrangement structure. Wait patiently for the direction of the breakthrough. It should now belong to the bottom area of the triangle to focus on or open a position. The stop loss level is -1% of your cost price. Because there are no signs of stopping the decline. The benefit of a stop loss is that it avoids continuing to fall, and you can buy it back after the stop loss is out of the market. I'd rather make less money than lose a lot!

Disclaimer: Community is offered by Moomoo Technologies Inc. and is for educational purposes only.
Read more
Comment
Sign in to post a comment

Leo2827 : On the way to shorting? pal
羊圈圈 : According to the timeline, if it fluctuates to the far right, it's probably the next year