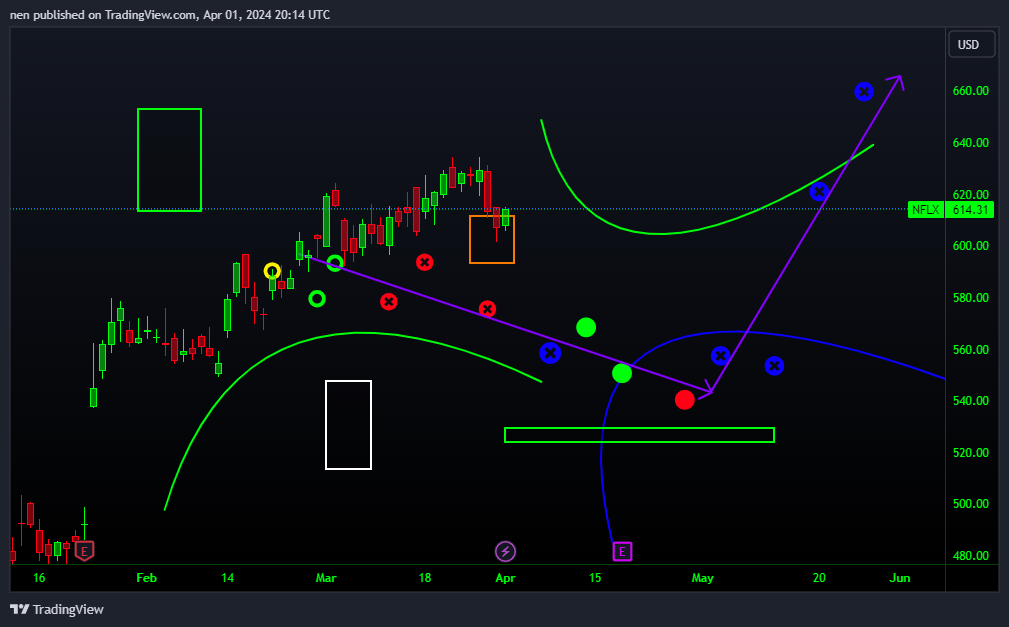
$NFLX Sniper
Simple setup with some projected data points as price targets in time. If and only if at least 3 of them are hit, and maybe a wild card pivot point at any of the elements, preferably the pink rectangle, I would strongly suggest analyzing the potential for a bounce from the green rectangle zone in case another power wave forms that pushes the price higher. The idea is to hunt for the potential power wave, as these are the most fun to trade: momentum, volatility, few days in a trade but with bigger moves.
Touchdown on the orange and a potential inflection point. If the dots keep getting ignored and missed, we might see some support (or resistance) at the green curve.

Top green curve acting as resistance. Waiting for another such interesting "coincidence" in this project for the future. Fingers crossed.

An interesting situation with what could be considered as a break and retest of the green curve. Not an ideal situation to be honest, would rather prefer to see another retest and rebound from this later on. (white circle example)

Disclaimer: Community is offered by Moomoo Technologies Inc. and is for educational purposes only.
Read more
Comment
Sign in to post a comment
