

Tech Analysis To Identify Trend Using MACD 📈 Day 2 (AMC As Example)
Previous post:
Milk The Cow :Tech Analysis To Identify Trend Using Moving Average - MA 📈 Day 1 (AMC As Example)
Milk The Cow :Tech Analysis To Identify Trend Using Moving Average - MA 📈 Day 1 (AMC As Example)
What is moving average convergence divergence (MACD)?
A trend-following momentum indicator that shows the relationship between two moving averages of a security’s price.
A trend-following momentum indicator that shows the relationship between two moving averages of a security’s price.
MACD is calculated by subtracting the 26-period exponential moving average (EMA) from the 12-period EMA.
9-day EMA of the MACD called the "signal line". It's plotted on top of the MACD line to function as a trigger for buy and sell signals.
NOTE: Actually u do not really need to know the calculation of MACD![]() to use it.
to use it.
The MACD indicator in the apps has already done those for u.
But, it's still good to know![]() .
.
The MACD indicator in the apps has already done those for u.
But, it's still good to know
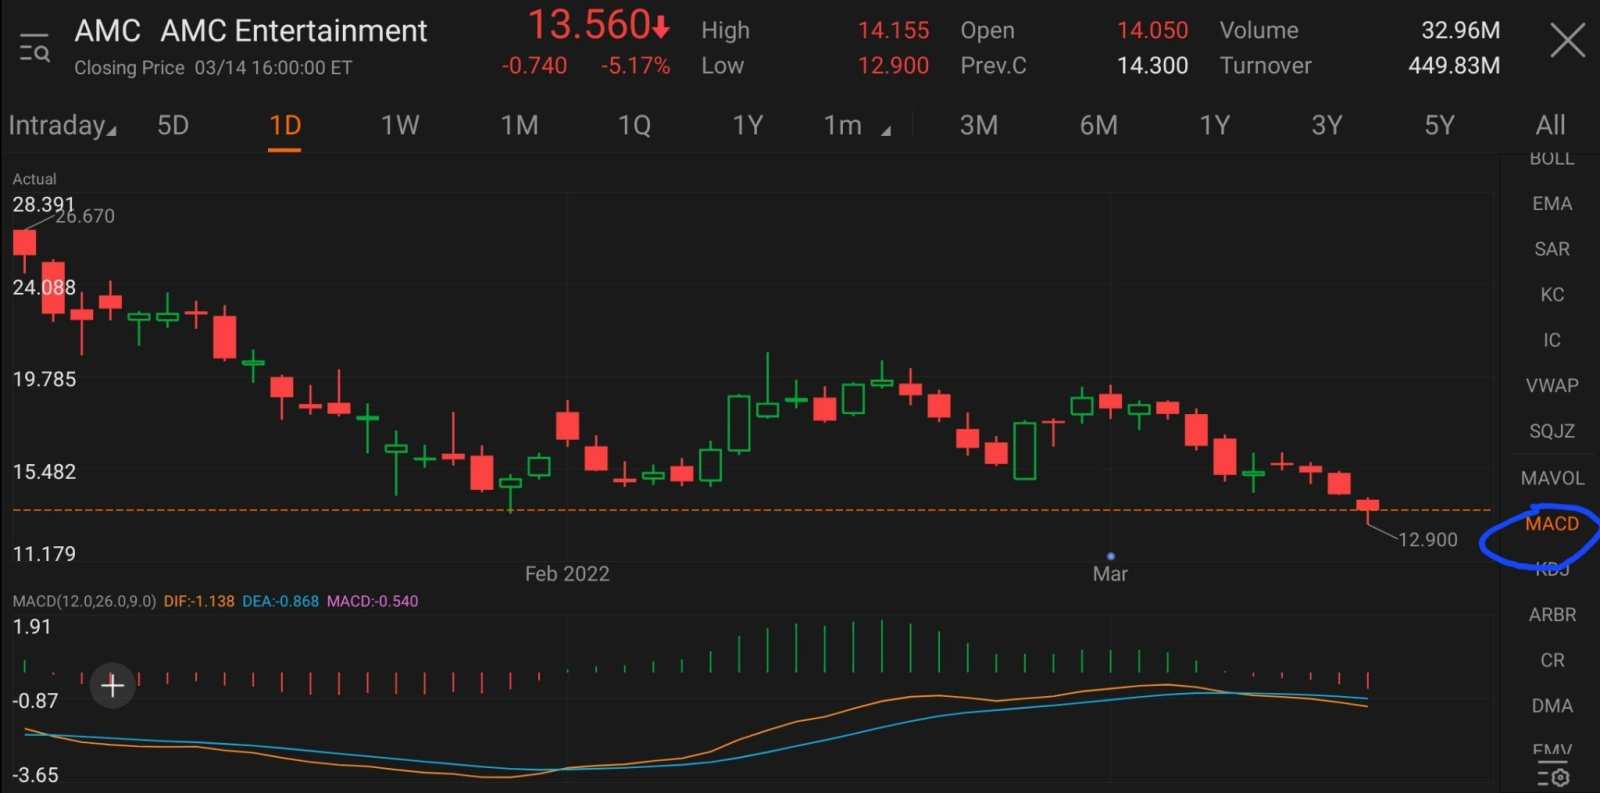
Now that u know the definition of MACD, let's apply it on the $AMC Entertainment(AMC.US$ graph 📊 . (Using mobile 📱 version... damn, someone go do the desktop version for us![]() .)
.)
Select MACD (Tip: U double tap on graph from origin quotes to full screen the graph):
Extra informations:
U can go to "Indicators" setting to see the default setting for MACD in which I think nothing required changing![]() (As shown in my previous post.)
(As shown in my previous post.)
U can go to "Indicators" setting to see the default setting for MACD in which I think nothing required changing

So, how u use MACD?
Firstly, u will want check out @Meta Moo post on MACD:
Meta Moo :Technical Analysis Challenge Day 2 - MACD
(Not bad at all, that's generally the whole idea on how to use MACD![]() .
.
Save me some troublesome work![]() .
.
Though, I will still use it to apply on AMC as an example![]() .)
.)
Firstly, u will want check out @Meta Moo post on MACD:
Meta Moo :Technical Analysis Challenge Day 2 - MACD
(Not bad at all, that's generally the whole idea on how to use MACD
Save me some troublesome work
Though, I will still use it to apply on AMC as an example
P1:

(Monkey 🐒 cannot draw 🎨 straight lines too![]() )
)
Orange line = DIF (MACD Curve)
Blue line = DEA (Signal Curve)
Pink = MACD
Can be confusing but all u need to know is:
Orange line cut above Blue line = possible up trend
Orange line cut below Blue line = possible down trend
Both lines intercept = a signal for buy/sell
Blue line = DEA (Signal Curve)
Pink = MACD
Can be confusing but all u need to know is:
Orange line cut above Blue line = possible up trend
Orange line cut below Blue line = possible down trend
Both lines intercept = a signal for buy/sell
P2:

Note: As u see in the above image, negative value = Down trend
Positive value = Up trend
This is used to apply on P1. I mentioned those trend in P1 is just a possible short-term trend.
(Usually, u may want to buy at the positive value to be more safe. You ownself decide![]() .)
.)
Positive value = Up trend
This is used to apply on P1. I mentioned those trend in P1 is just a possible short-term trend.
(Usually, u may want to buy at the positive value to be more safe. You ownself decide
P3:

U may notice there're the green & the red.
I guess that's where u also determine a buy or sell.
I pay little attention to those.
Check out @Meta Moo for more informations (The moomoo tech analysis - TA![]() ):
):
Meta Moo :Technical Analysis Challenge Day 2 - MACD
I guess that's where u also determine a buy or sell.
I pay little attention to those.
Check out @Meta Moo for more informations (The moomoo tech analysis - TA
Meta Moo :Technical Analysis Challenge Day 2 - MACD
Yup, that's all from me, I guess![]() .
.
You've just 🎓 from Milk The Cow Lesson on MACD![]() if u have read 📚 all the way to here
if u have read 📚 all the way to here![]() .
.
You've just 🎓 from Milk The Cow Lesson on MACD
As always, DYODD first before investing![]()
Edited:
Next update of posts sequence (event):
Milk The Cow :Tech Analysis To Identify Trend Using Exponential Moving Average - EMA 📈 Day 3 (AMC A...
Next update of posts sequence (event):
Milk The Cow :Tech Analysis To Identify Trend Using Exponential Moving Average - EMA 📈 Day 3 (AMC A...
Disclaimer: Community is offered by Moomoo Technologies Inc. and is for educational purposes only.
Read more


Comment
Sign in to post a comment

Meta Moo : very simple, concise and beautiful explained


Milk The CowOP Meta Moo: Ty