Moomoo pattern interpretation
1. Introduction
Pattern interpretation forecasts the stock price trend in the next 3 days via an algorithm that integrates historical candle chart data and the recent stock price trend; at the same time, big data analysis helps screen stocks with matching patterns.
2. Function Pathway
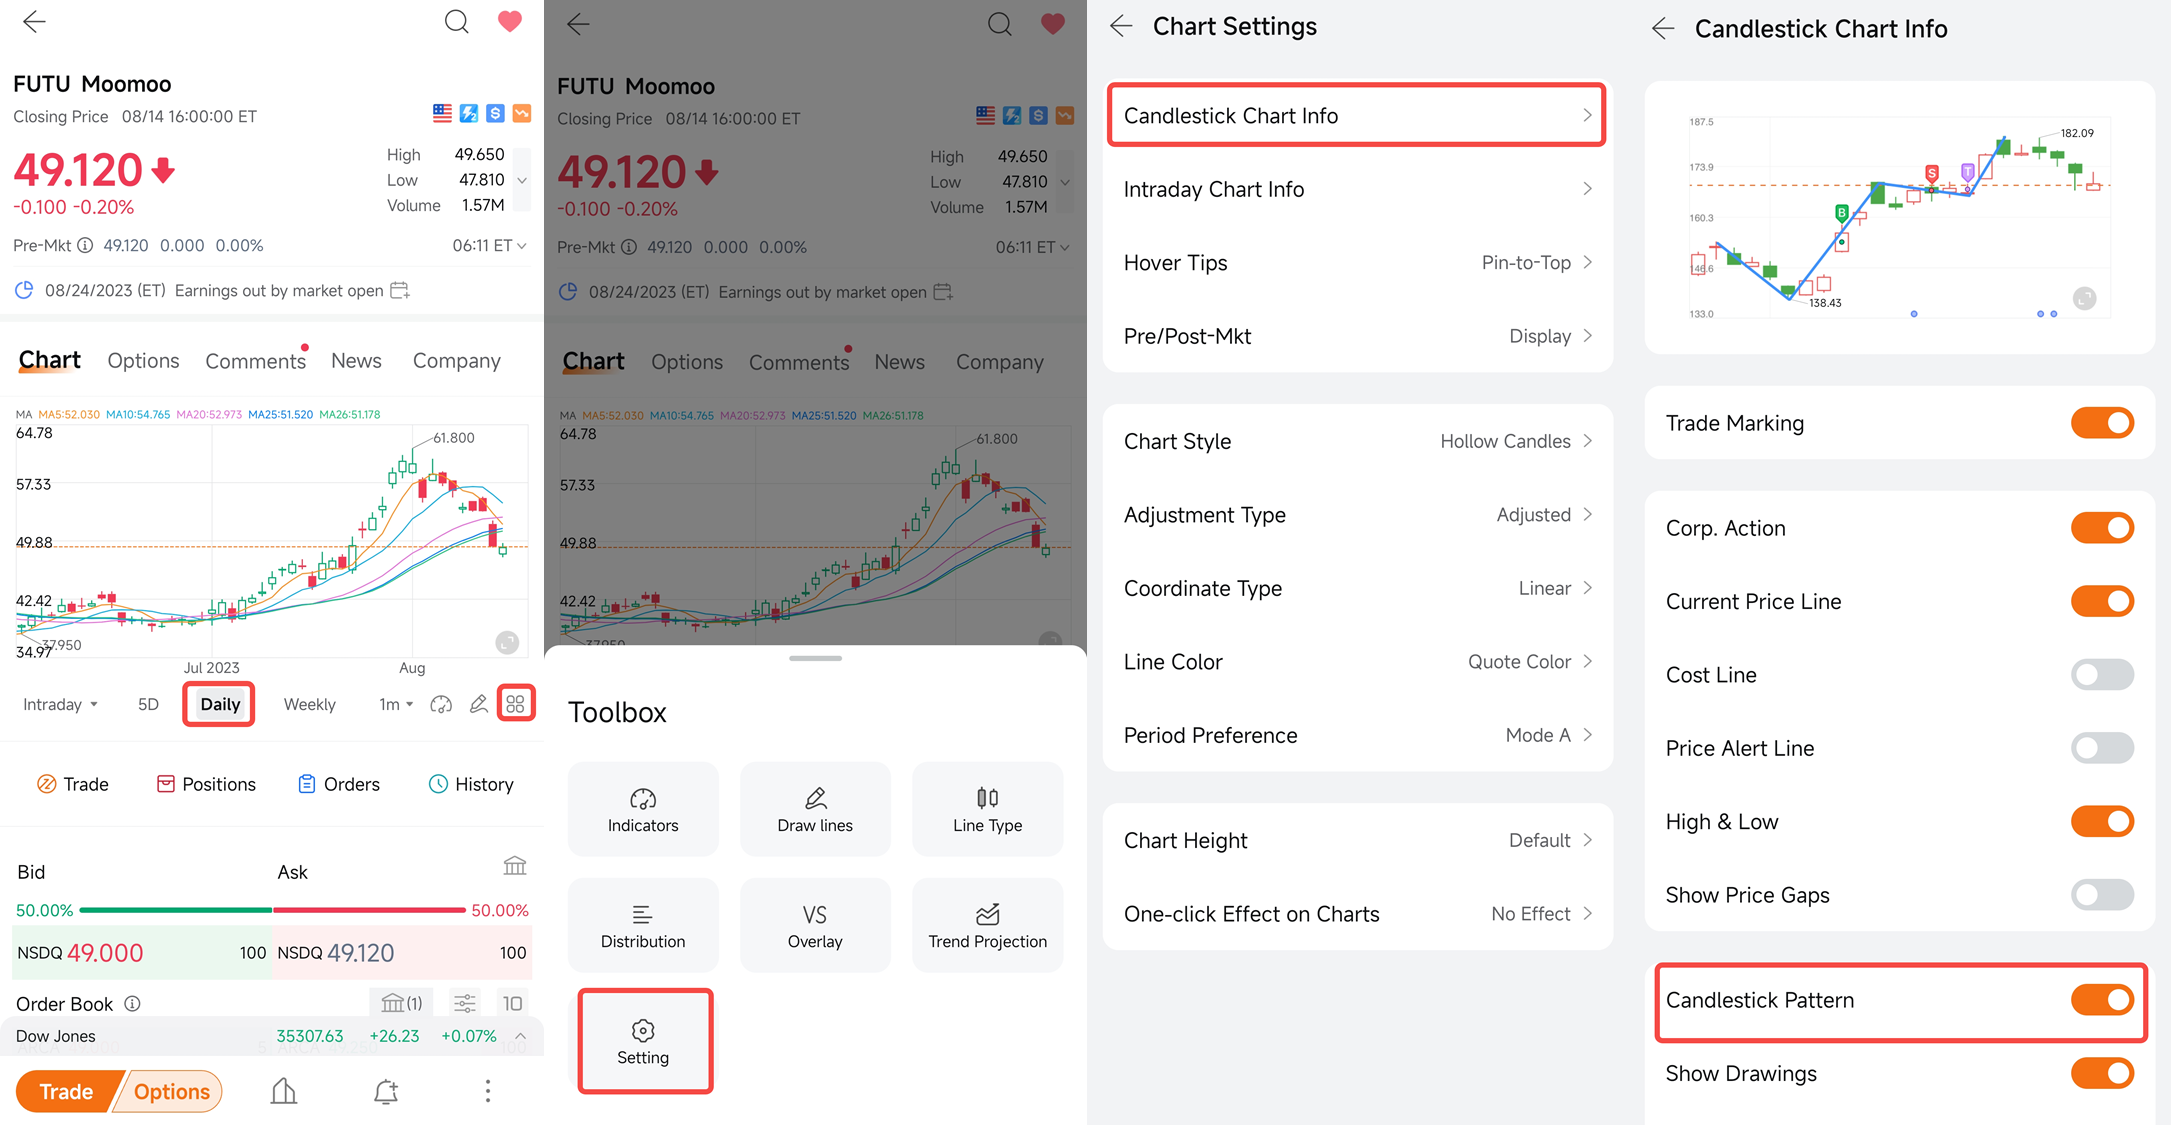
2.1 Pattern Interpretation
Path: Stock Quote Page > Chart > Daily > Toolbox > Settings > Candlestick Chart Info > Candlestick Pattern
*To use this feature, a stock's trend should conform to a specific candlestick pattern, and the Candlestick Pattern option should be enabled in the Chart Markings settings. To view stocks that conform to certain candlestick patterns, go to Markets > HK, US, or other stock pages > Candlestick Patterns.
Currently, this feature is only available in Hong Kong, the United States, and Japan.
Please note that the application interface and its content shown above may differ from the actual application interface and content. To avoid any discrepancies, please update the application to the latest version available. The securities mentioned in the screenshot are for illustrative purposes only and should not be construed as investment advice.
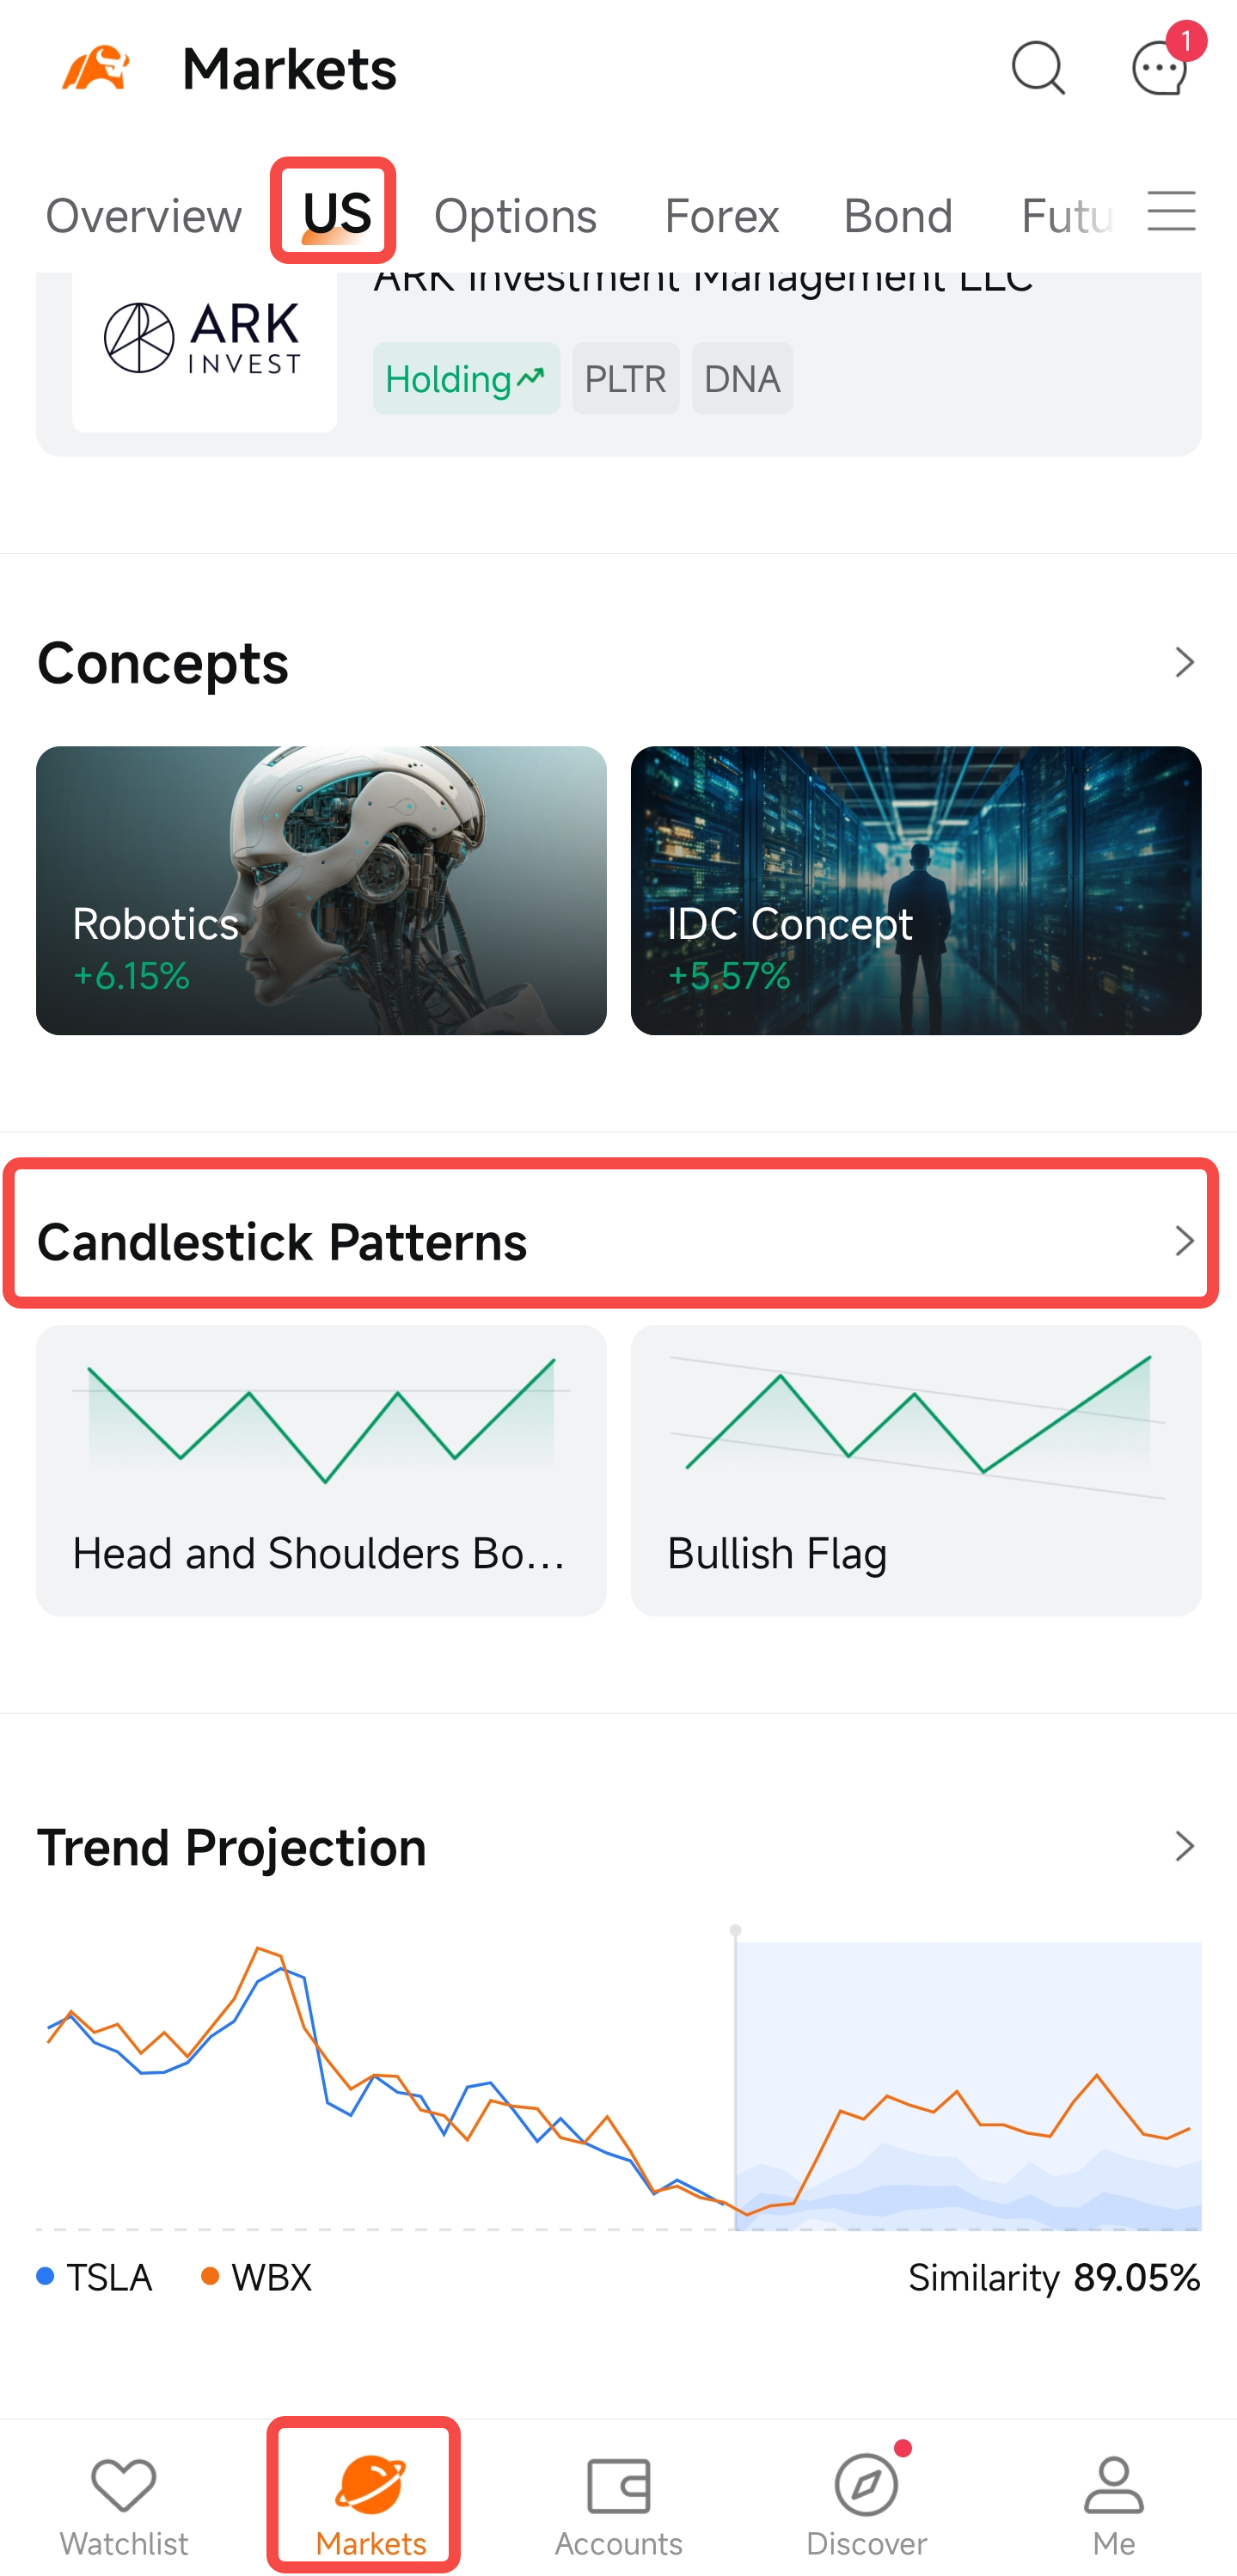
2.2 Pattern Screener
Path: Markets > US > Candlestick Patterns
Please note that the application interface and its content shown above may differ from the actual application interface and content. To avoid any discrepancies, please update the application to the latest version available. The securities mentioned in the screenshot are for illustrative purposes only and should not be construed as investment advice.
3. How to use it
The candle chart pattern feature consists of pattern interpretation and pattern screener.
3.1 Pattern Interpretation
● Entry: Stock Quote Page > Chart > Daily > Toolbox > Settings > Candlestick Chart Info > Candlestick Pattern
● Introduction: For users' reference, pattern interpretation forecasts the stock price trend for the next three days on the basis of historical candle chart patterns and recent price-volume changes of the stock.
● Starting Time: The time when the pattern appeared;
● Pattern Types: Bearish or Bullish;
● Probability of Rising/Falling: A forecasting indicator showing an estimate of how likely the stock is to rise or fall in the next three days once this pattern appeared;
● Reversal Probability: A reference probability that the current stock price trend might reverse;
● Support Level: A forecasting indicator showing the stock price that may constitute a support level in the next three days once this pattern appeared;
● Resistance Level: A forecasting indicator showing the stock price that may constitute a resistance level in the next three days once this pattern appeared;
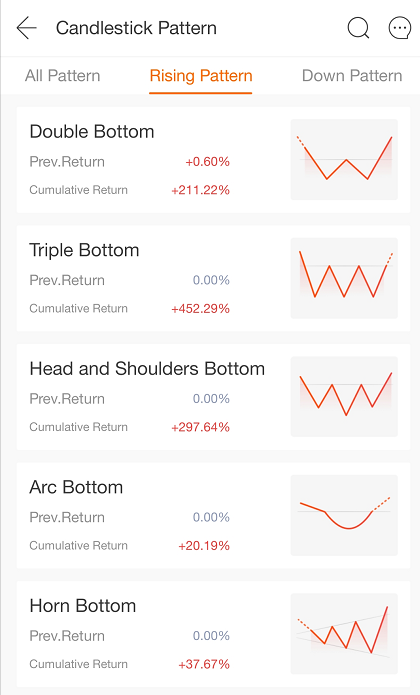
3.2 Pattern Screener
Pattern screener is to automatically identify stocks through the system, and select the stocks that best fit the pattern. Pattern stock picking currently supports 20 patterns, namely:
● Bullish Patterns (10 Types): Double Bottom, Triple Bottom, Head and Shoulders Bottom, Rounding Bottom, Broadening Wedge Bottom, Bullish Flag, Bullish Symmetrical Triangle, Bullish Continuation Diamond, Bullish Continuation Wedge, and Bullish Continuation Triangle.
Please note that the application interface and its content shown above may differ from the actual application interface and content. To avoid any discrepancies, please update the application to the latest version available. The securities mentioned in the screenshot are for illustrative purposes only and should not be construed as investment advice.
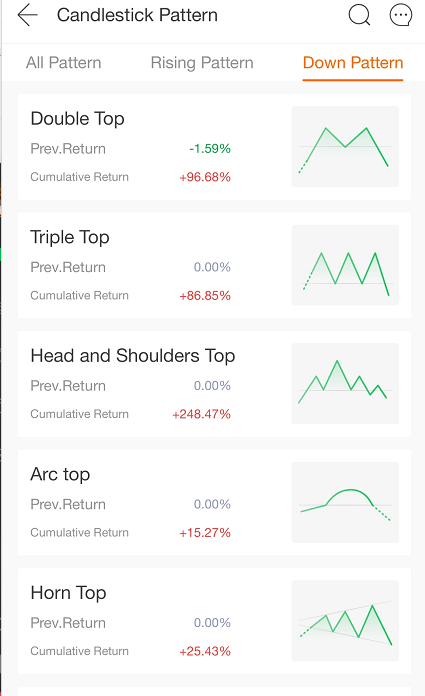
● Bearish Patterns (10 Types): Double Top, Triple Top, Head and Shoulders Top, Rounding Top, Broadening Wedge Top, Bearish Flag, Bearish Symmetrical Triangle, Bearish Continuation Wedge, and Bearish Continuation Triangle.
Please note that the application interface and its content shown above may differ from the actual application interface and content. To avoid any discrepancies, please update the application to the latest version available. The securities mentioned in the screenshot are for illustrative purposes only and should not be construed as investment advice.
This presentation is for informational and educational use only and is not a recommendation or endorsement of any particular investment or investment strategy. Investment information provided in this content is general in nature, strictly for illustrative purposes, and may not be appropriate for all investors. It is provided without respect to individual investors’ financial sophistication, financial situation, investment objectives, investing time horizon, or risk tolerance. You should consider the appropriateness of this information having regard to your relevant personal circumstances before making any investment decisions. Past investment performance does not indicate or guarantee future success. Returns will vary, and all investments carry risks, including loss of principal. Moomoo makes no representation or warranty as to its adequacy, completeness, accuracy or timeliness for any particular purpose of the above content.