Moomoo Singapore 2H2024 Market Outlook

H2 2024 Global Market Outlook
Major Themes this Half:
TO CUT OR NOT TO CUT IS NOT THE QUESTION - HIGHER FOR LONGER IS HERE TO STAY WITH A POSSIBLE 'CREDIBILITY' CUT.
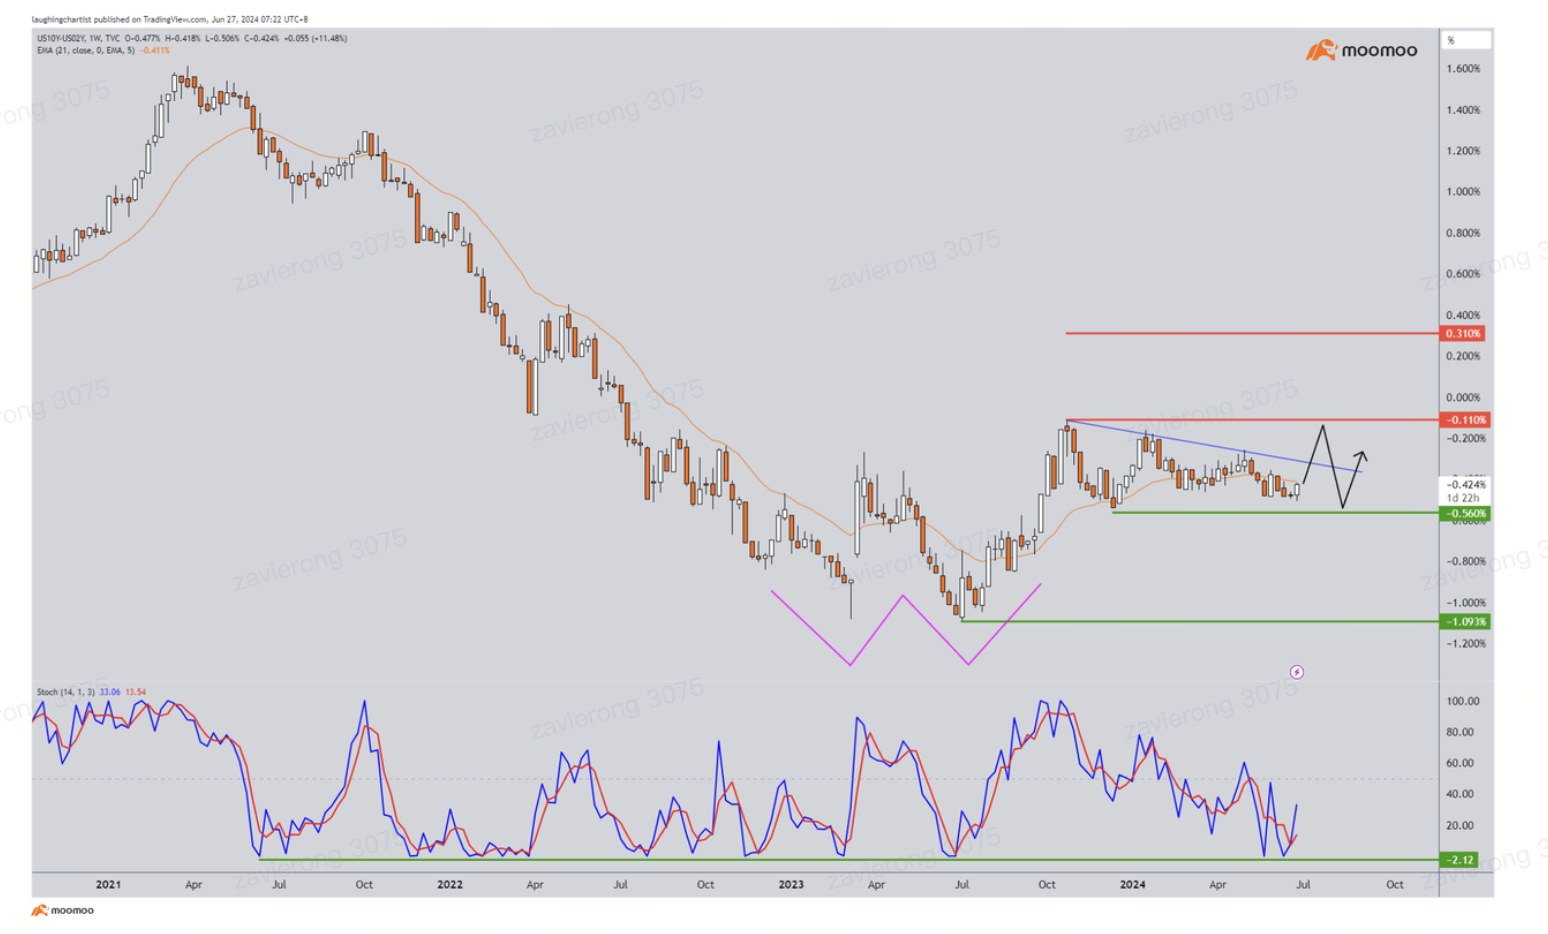
Rates have been higher for longer, inflation is not just sticky but rather, persistent. From expecting 3 rate cuts in January, to 2 rate cuts in April.. Now in June, we are down to 1. This is what I call the 'credibility' cut just for the US Fed to maintain its reputation. Unless the size of the cut is huge, or rapid. It is simply patronizing. [Investors should continue to allocate a portion of their portfolio to the short-end interest rate products / short-term treasuries as long as the yield curve remains inverted.]
NAVIGATING VUCA MARKETS IN THE EVENT OF POSSIBLE GEOPOLITICAL BLOWOUT(S).
A geopolitical blowout here is not just about the on-going war in Europe and Middle-East. But also referring to the strained relations between China and the US. Moreover, this year is the year of global elections. For most of the major elections, there have been very surprising developments along the way (e.g Taiwan, South Korea, India, France, EU, UK and US). In light of these VUCA (volatile, uncertain, complex and ambiguous) scenarios, investors and traders alike should always be aware of their risk exposure, stay tactically diversified and nimble.
MORE THAN MEETS THE "EYE" - DESPITE WHISPERS OF SIMILARITIES WITH THE DOT COM BUBBLE, AI STILL HAS ROOM FOR FURTHER GROWTH.
AI is not a new topic. It has been a field of interest since the 1960s. However, the modern AI frenzy with machine learning / deep learning really only started in 2016 when AlphaGo an AI program from DeepMind convincingly defeated one of the world's best player in a series of Go games. In 2018, Open AI's GPT-2 followed by GPT-3 was introduced, with the pandemic in 2020 accelerating digital transformation and AI adoption across multiple sectors. This exponential growth also came with an increased demand for processing power. At present, while there are considerable similarities between modern AI frenzy and the Dot-com bubble, the longer term potential for AI integration across various sectors and economics will have the power to fundamentally change the way the world works.
Key Calls
Some Trade Ideas we Like:
US and Japan Equities We still favour US and Japan equities. While a lot of market chatter still points to valuations being high and the AI frenzy having similarities to the Dot-com bubble in the 2000s, investors need to realise that technology companies have much stronger earnings compared to 2 decades ago. There is also a higher percentage of companies within the S&P500 that are making new highs now compared to back then. Japanese equities will also stand to gain from forward looking corporate and structural reforms that strive to bring more value to shareholders along with wage raises. Further, Japanese companies that are contributing to the global AI supply chain and development will still have further upside potential.
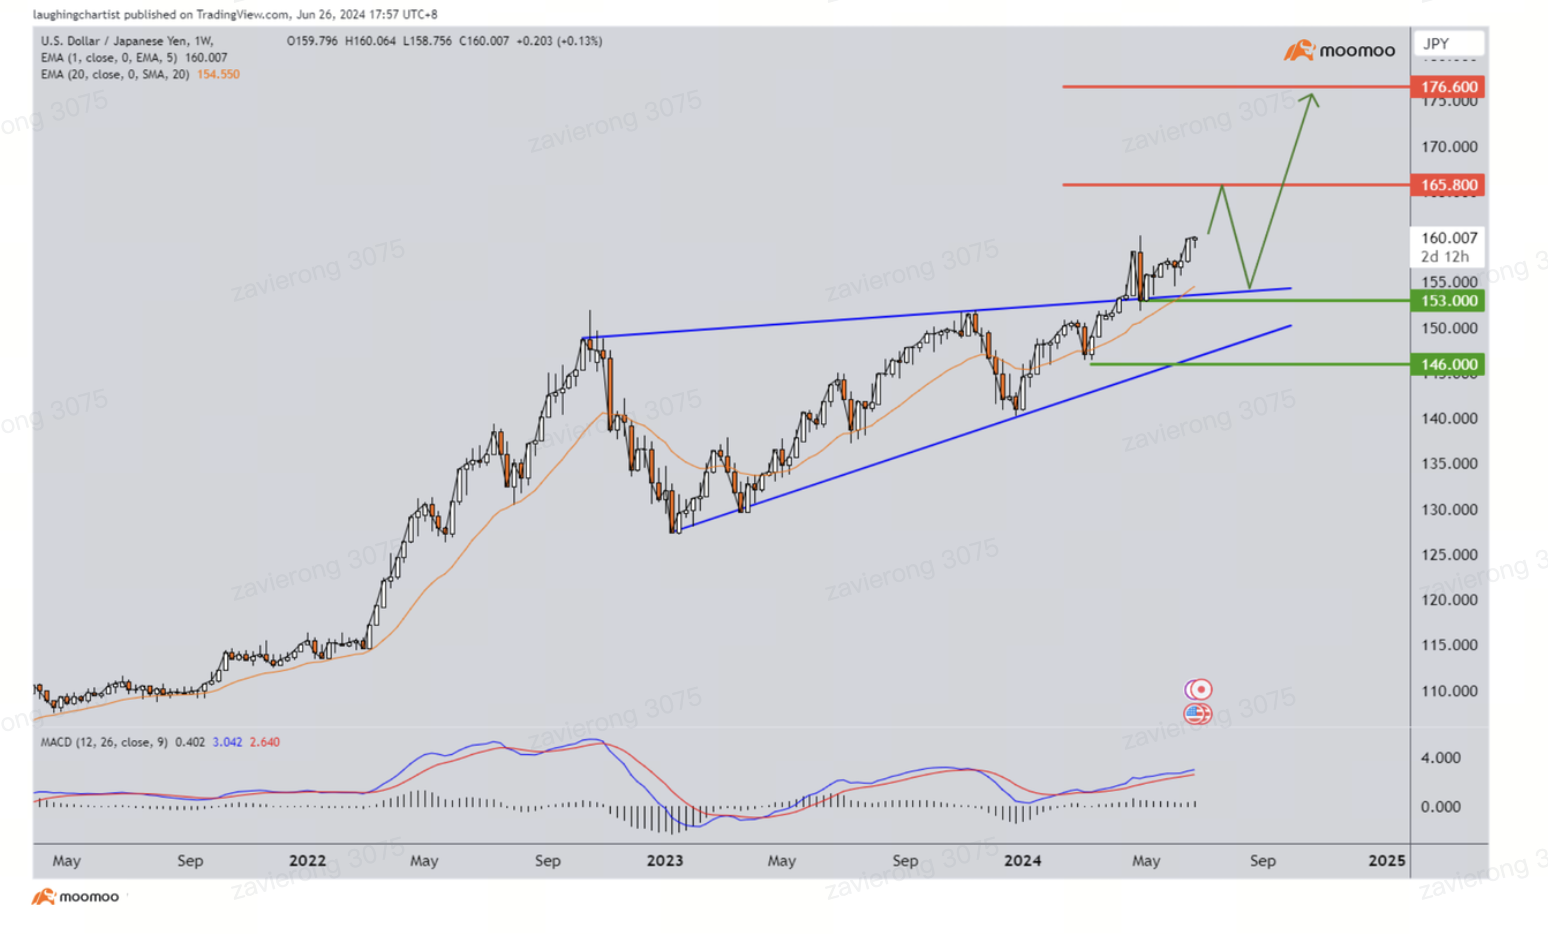
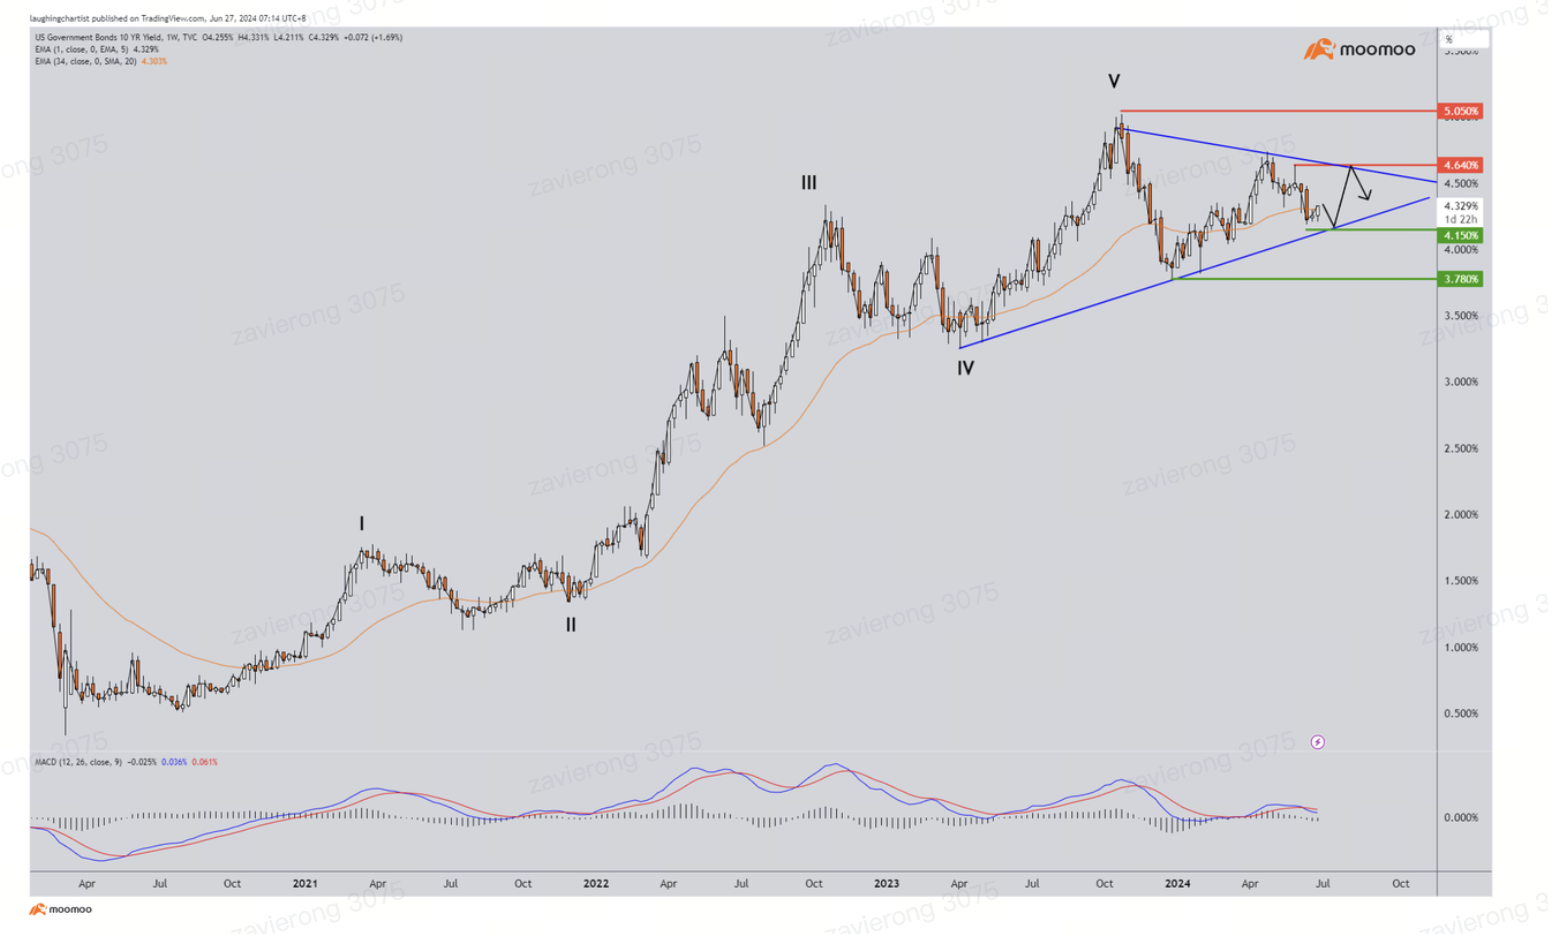
Fixed Income When the US Fed starts cutting rates, investors can expect the USD to weaken further, starting a fresh phase of dollar underperformance. Until the rate cuts happen, investors should continue to hold onto short dated treasury bonds which provide a higher yield. Only after the US Fed starts easing, should investors look at rotating their capital towards IG bonds to still keep the same rate of returns while minimising downside risks.
Count On Me Singapore Going forward into H2 2024, we are expecting markets to be more VUCA (Volatile, Uncertain, Complex and Ambiguous). With strained geopolitical relationships across the globe, risk of regional conflicts given the current localised wars (in Europe and Middle-East), surprising and unexpected election results and also the upcoming US presidential elections, Singapore stocks and the SGD can be a good hedge against such shocks. MAS has shown its committment to defend the SGD through previous market shocks. And because of this, SGD can be considered a good store of value. Investors should consider high dividend paying SG stocks as a sort of a hedge and more defensive play. (Stocks like DBS, OCBC and Singtel etc)
Equities At A Glance
Key Themes for Equities:
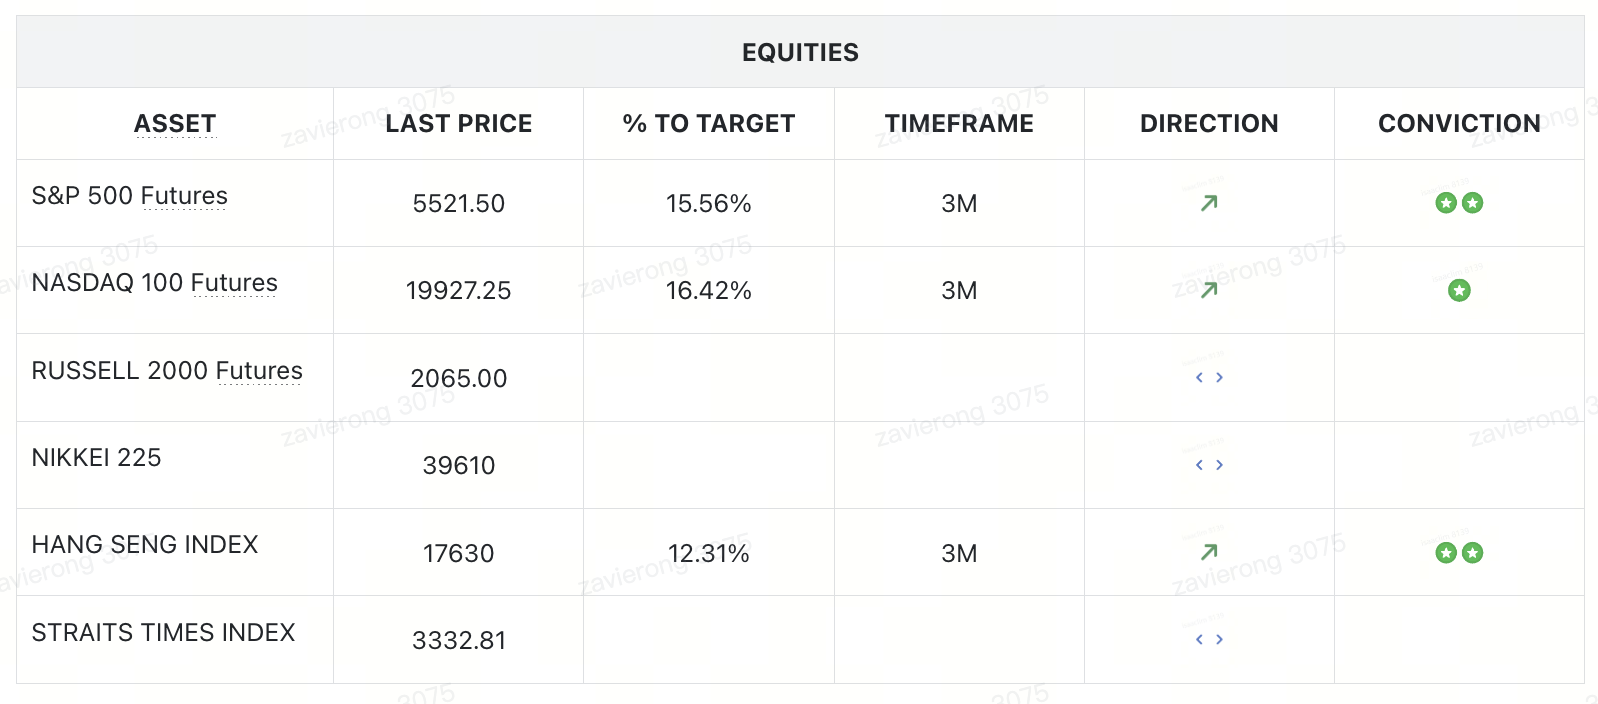
S&P IS POISED FOR A FRESH LAUNCH HIGHER FOLLOWING NEAR-TERM WEAKNESS. TECH MEGACAPS ARE ONCE AGAIN EXPECTED TO LEAD.While S&P has pretty much been a one-way street since the start of 2023, it has really been due to the magnificent 7 or more recently, the magnificent 1. The megacap tech sector lifted the S&P to new historical highs almost every other week since January 2024, leaving the rest of the sectors behind. H1 2024 saw megacap tech names leading the charge. For H2 2024, we expect greater AI adoption in other sectors, allowing them to catch up with the megacap tech stocks.
STRUCTURAL REFORMS UNDERWAY IN JAPAN'S INFLATIONARY ERA - JAPANESE EQUITIES STILL HOLD POTENTIAL AGAINST S&P (EQUAL WEIGHT). The BoJ has only raised rates only once this year in response to increasing inflation. However, over the past months, inflation has slowed. Further, the JPY continues to weaken further despite repeated intervention by the BoJ. This has dampened investors' confidence as the NIKKEI and TOPIX trade sideways in consolidation. However, there are structural reforms that have yet to impact the japanese economy. In recent times, Japan has seen the largest wage hike in 33 years. Corporate boards are now focusing more on returning values to shareholders by improving efficiency and profatibility due to reforms instituted by the Tokyo Stock Exchange (TSE). Finally, Japan is looking to become and important player in the global semiconductor supply chain. Given time, we expect fundamental reforms to start creating more opportunities for investors.
US ELECTIONS AND CHINA'S 3RD PLENUM, VOLATILITY IS TO BE EXPECTED WITH REFORMS LYING AHEAD.This year of global elections has been anything but predictable. With the US elections starting to go into full swing, neither incumbent President Biden or former President Trump enjoy broad-based support. There will be a chance that whoever wins the next term will still face a divided congress. This makes reformations within the US tricky and geopolitical tensions will still rock global equity markets. Over in China, investors will be closely watching the 3rd Plenum which will focus on modernizing and reforming China's economy amidst various domestic and international challenges. This could be the catalyst needed to improve China's fundamentals.
S&P 500 Futures
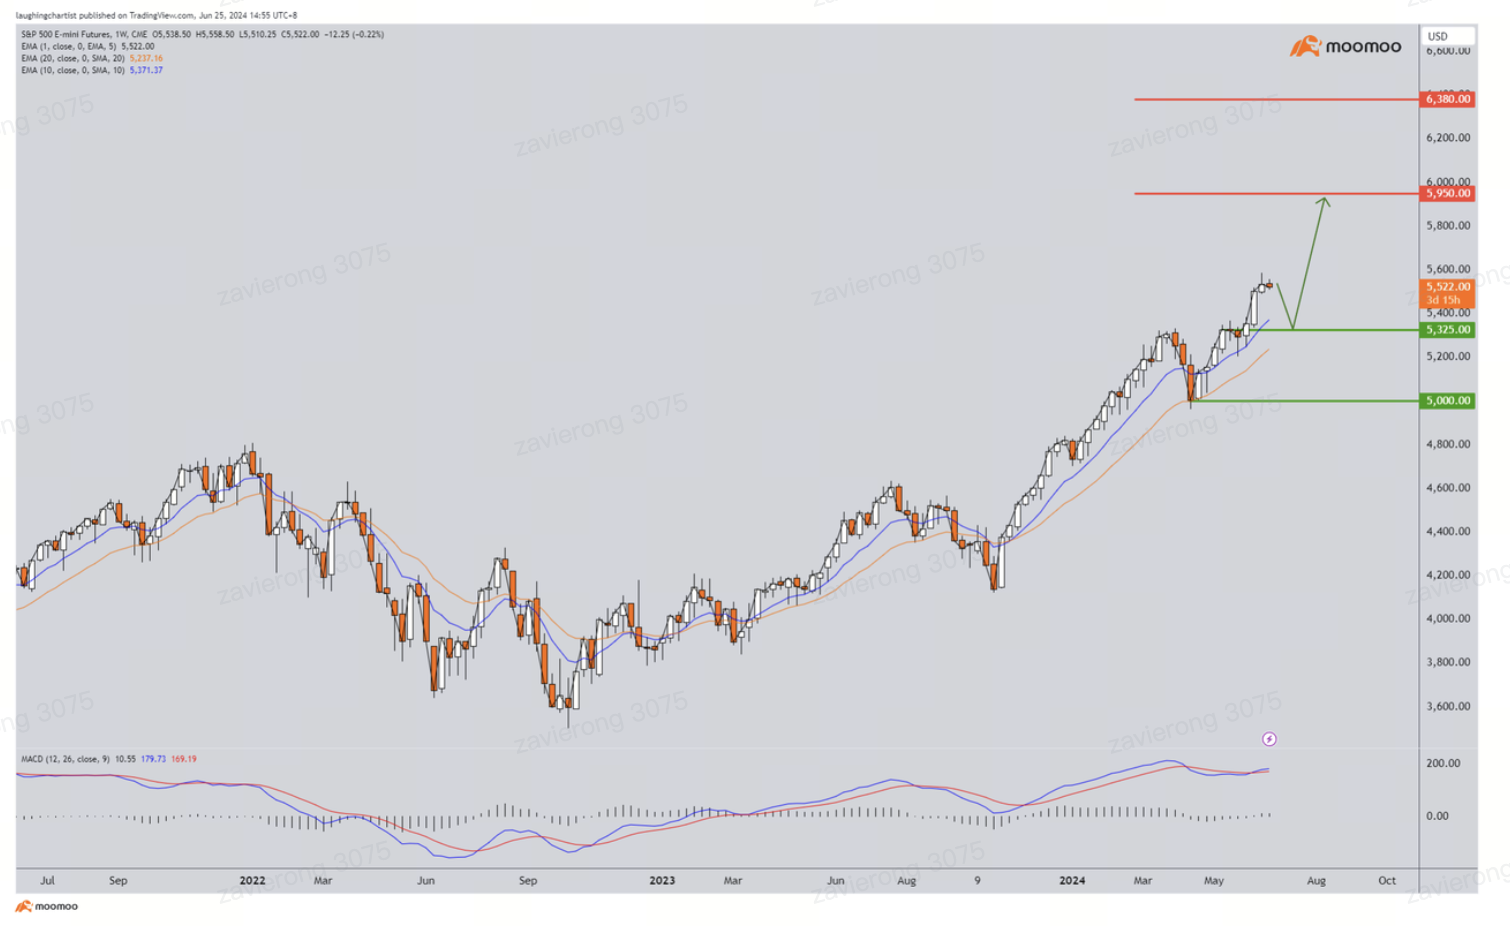
S&P500 Futures (Weekly Chart) - [BULLISH ↗️ **] S&P surged higher, shaping a new all-time high and surpassed previous target. We maintain our bullish bias. As long as price continues to trade above 5325, a further push higher towards 5950 resistance is expected. Technical indicators are advocating for bullish scenario as well.
Alternatively: A weekly candlestick close below 5325.00 support will open a deep setback towards next support at 5000.00
NASDAQ 100 Futures
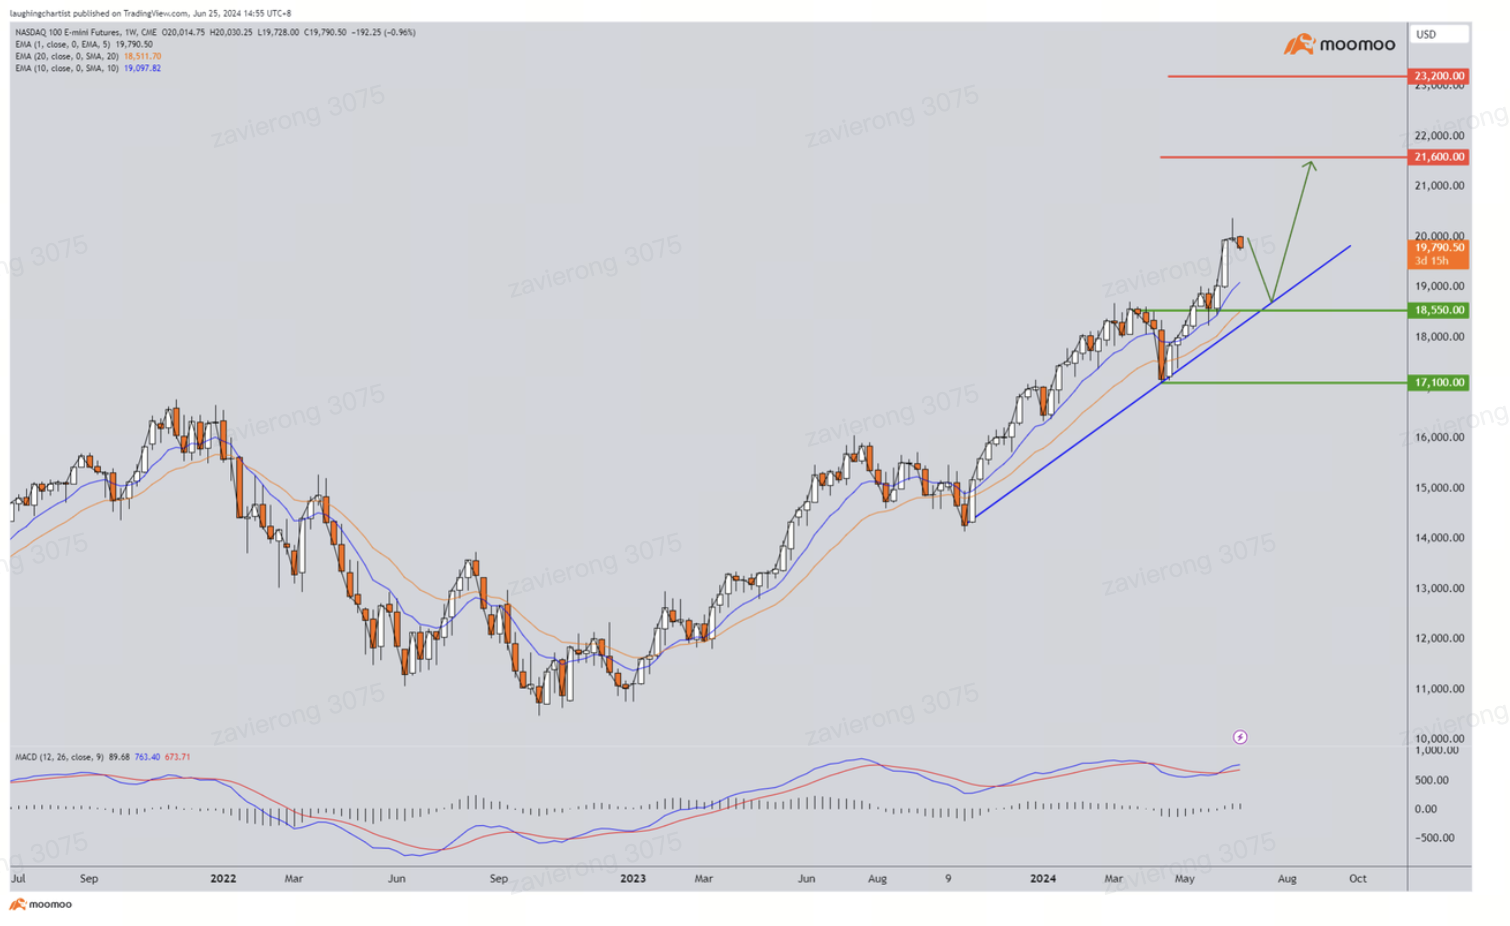
NASDAQ 100 Futures (Weekly Chart) - [BULLISH ↗️ **] NASDSAQ futures pushed higher, and also recently shaping an all-time high. We stay bullish on this chart, expecting the price to hold above 18550.00 support before shaping a new push higher towards 21600.00 resistance. Technical indicators are advocating for a bullish scenario.
Alternatively: A weekly candlestick close below 18550.00 support will open a setback towards the next support at 17100.00
RUSSELL 2000 Futures
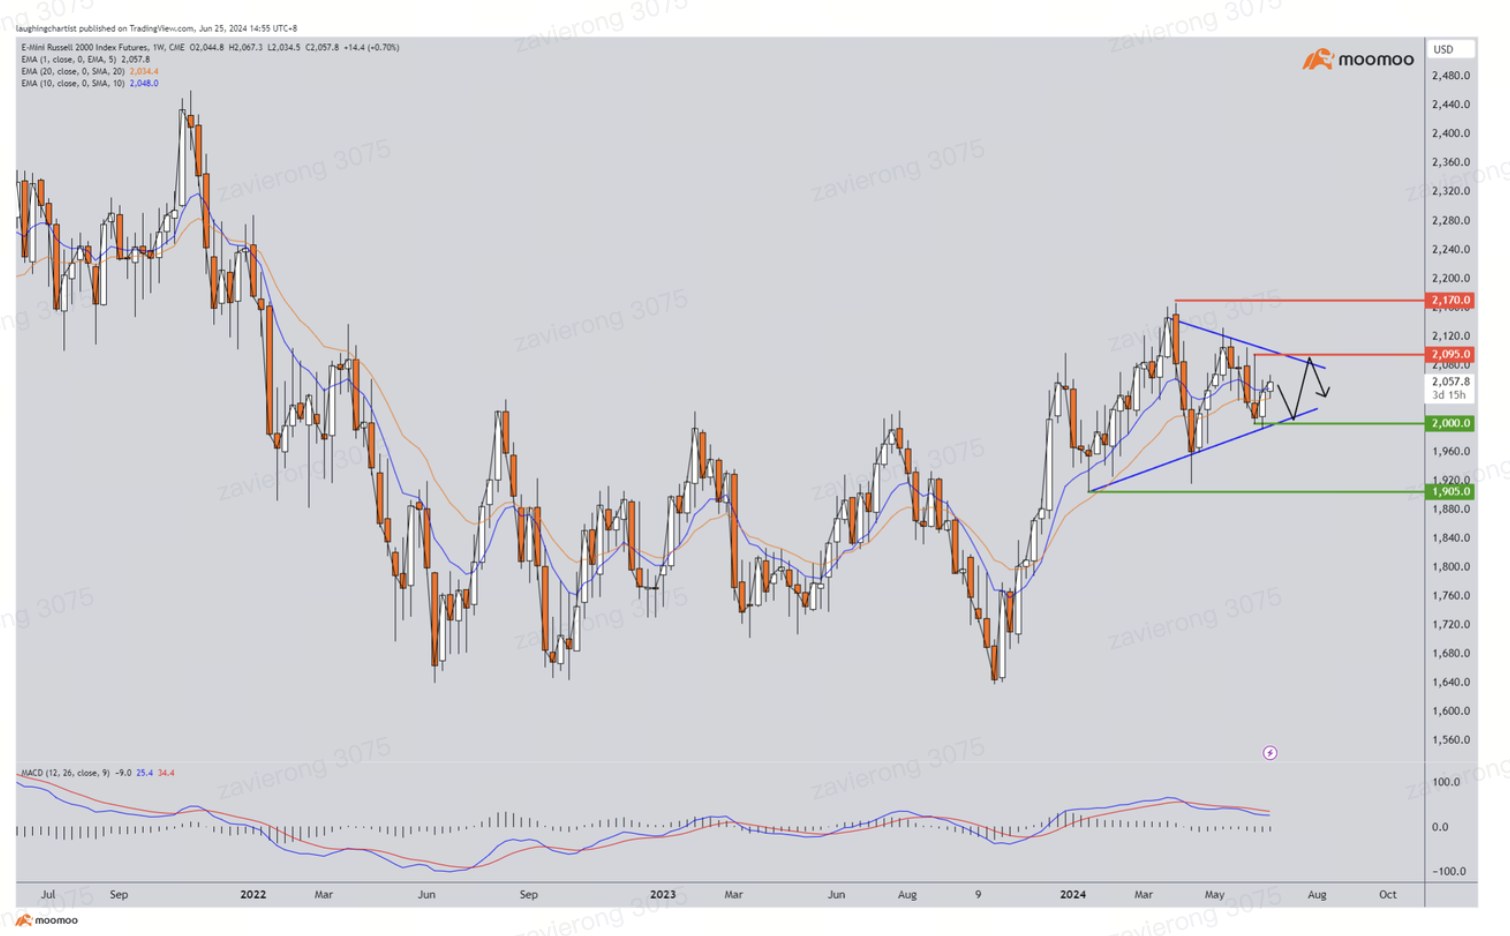
RUSSELL 2000 Futures (Weekly Chart) - [NEUTRAL] Russell futures previously broke out of a multi-year consolidation but is now once again trading within a triangle squeeze. We maintain our neutral view with no clear directional bias for now. A weekly candlestick close above 2095 will open a rise towards next resistance at 2170.00
Alternatively: A weekly candlestick close below 2000.00 will see price drop towards 1905.00 support next.
NIKKEI 225
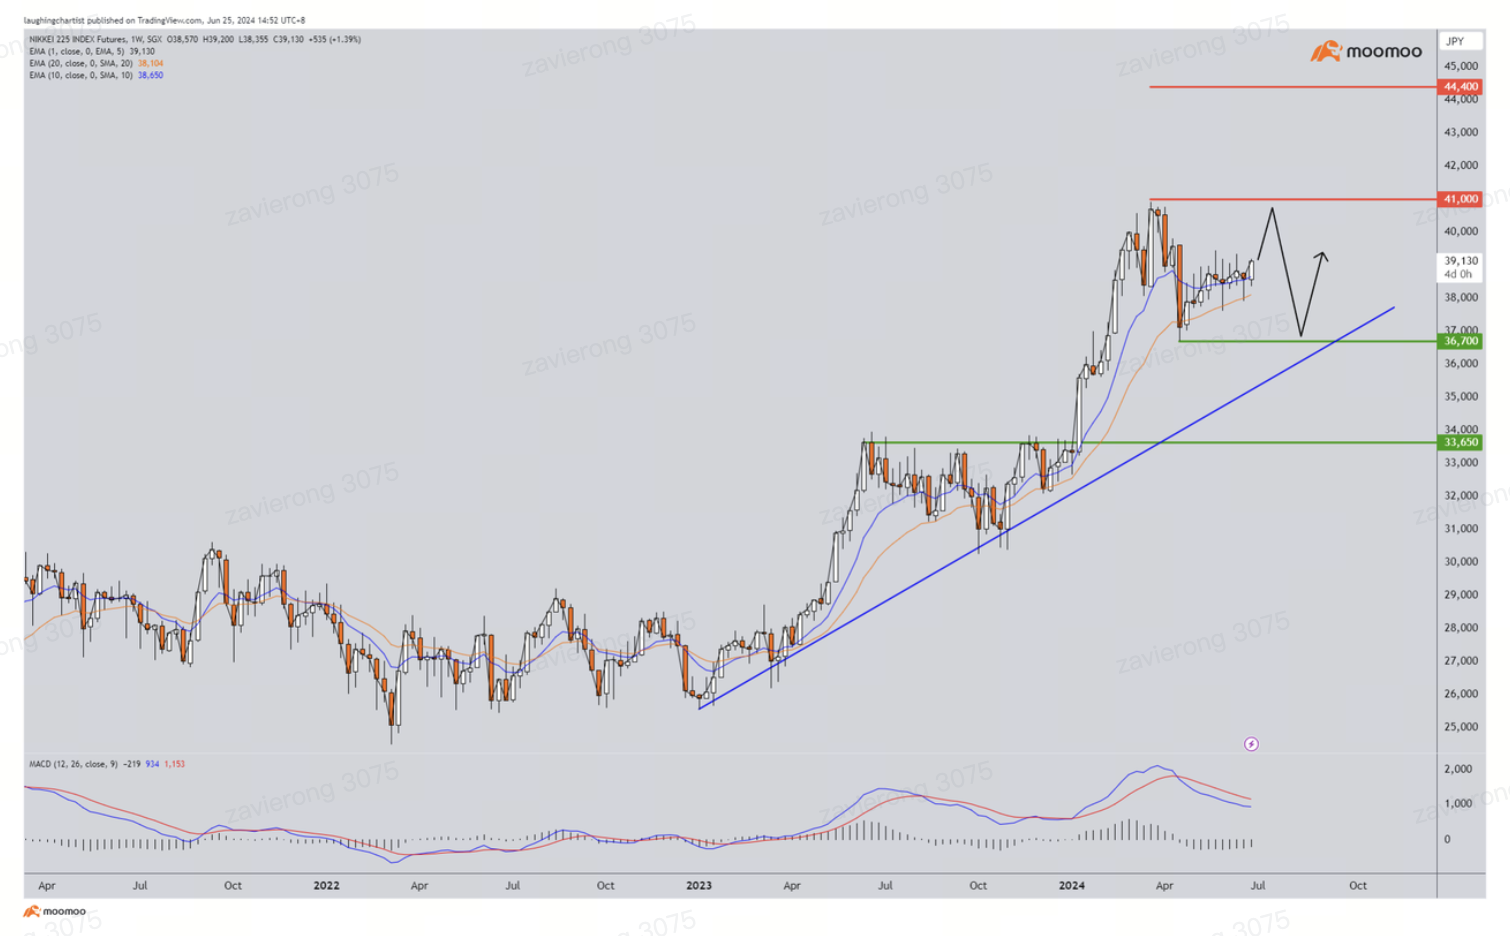
NIKKEI 225 (Weekly Chart) - [NEUTRAL] NIKKEI failed to push higher, and is now expected to consolidate between 41000 resistance and 36700 support. Only a weekly candlestick close above 41000 resistance will revive bullish scenario for a push towards next resistance at 44400. Technical indicators are still showing bullish signals . However, MACD is showing a slowdown in bullish momentum.
Alternatively: A weekly candlestick close below 36700 support will open a deeper correction towards 35650 support next.
HANG SENG INDEX
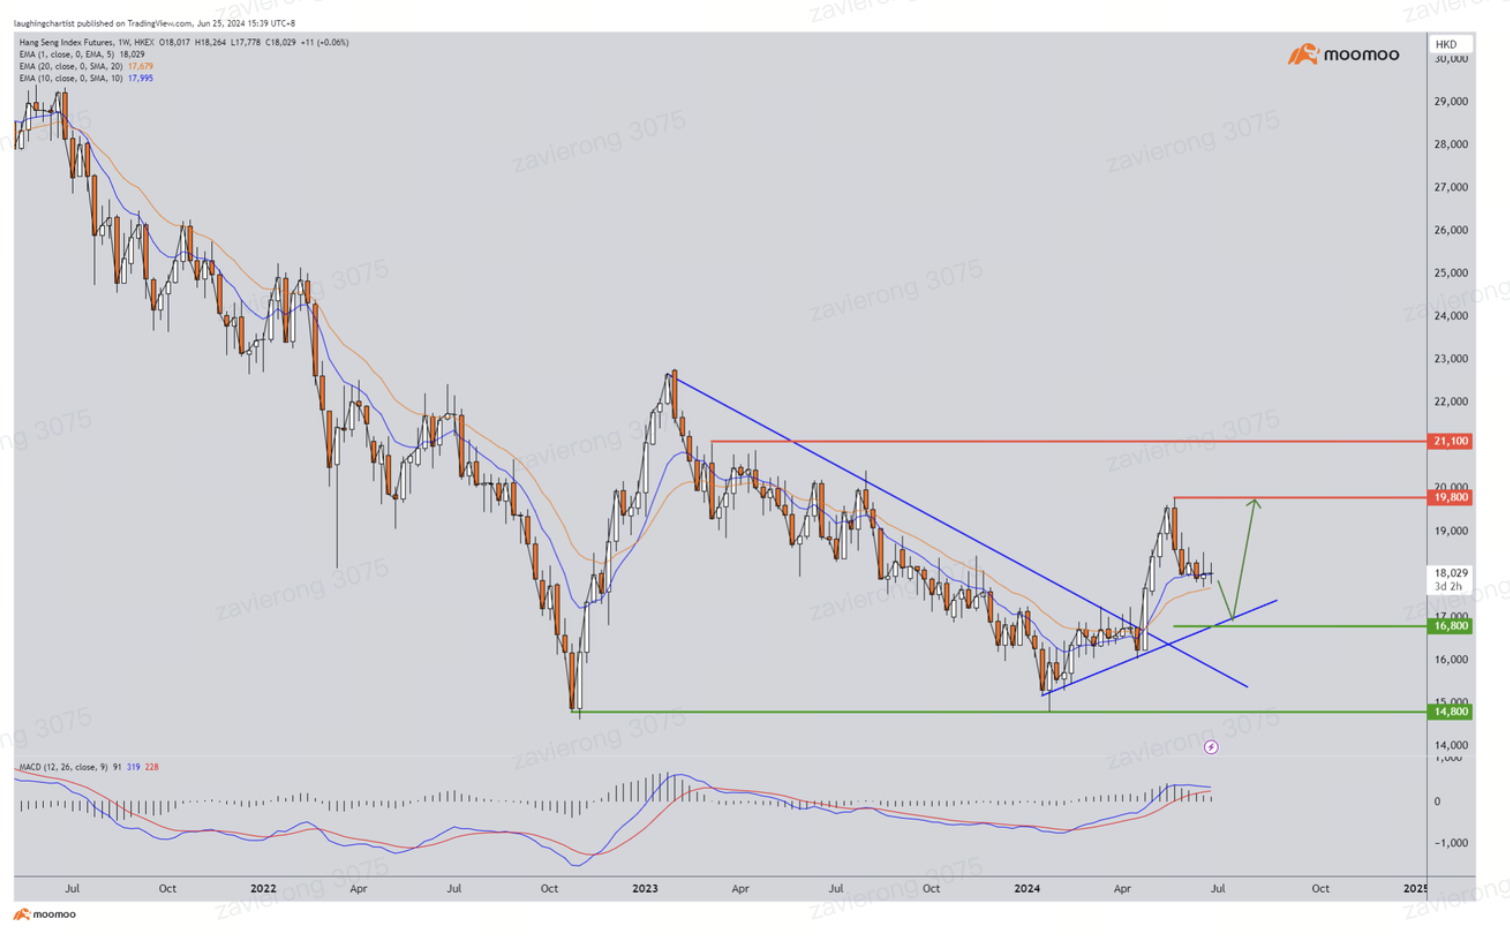
HANG SENG INDEX (Weekly Chart) - [BULLISH ↗️ *] HSI shaped a bullish exit of long term descending trendline and is holding above shorter term ascending trendline support. As long as price is holding above 16800 support, a pause above this level before a bounce towards 19800 resistance is expected. Price is holding above both short and long term EMAs. MACD is above 0, but relatively flat showing no real bullish momentum.
Alternatively: A weekly candlestick close below 16800 support will open a correction towards next support at 14800.
STRAITS TIMES INDEX

STRAITS TIMES INDEX (Weekly Chart) - [NEUTRAL] STI is testing and holding below long term descending trendline at 3355.00 resistance, with near-term key support at 3280.00. We maintain a neutral bias on STI with a slight bullish bias. As long as price stays between 3355.00 resistance and 3280.00 support. A weekly candlestick close above 3355.00 resistance will confirm a bullish breakout and see price push towards 3440.00 resistance next. Technical indicators are posting bullish signals.
Alternatively: A weekly candlestick close below 3280.00 support will open a correction towards next support at 3220.00
SPX (Market Cap) and SPX (Equal Weight) playing Catch Up

SPX(MC) vs SPX(EW) (Weekly Chart) - The current spread between the S&P500 (market-cap) and S&P500 (equal weighted) is the widest it has been in the past 5 years. Historically speaking, the index that is lagging behind is the one that would play catch up. This comes as no surprise in the event that we see a more widespread adoption of AI into the lagging sectors.
NIKKEI 225 index vs SPX (Equal Weight)
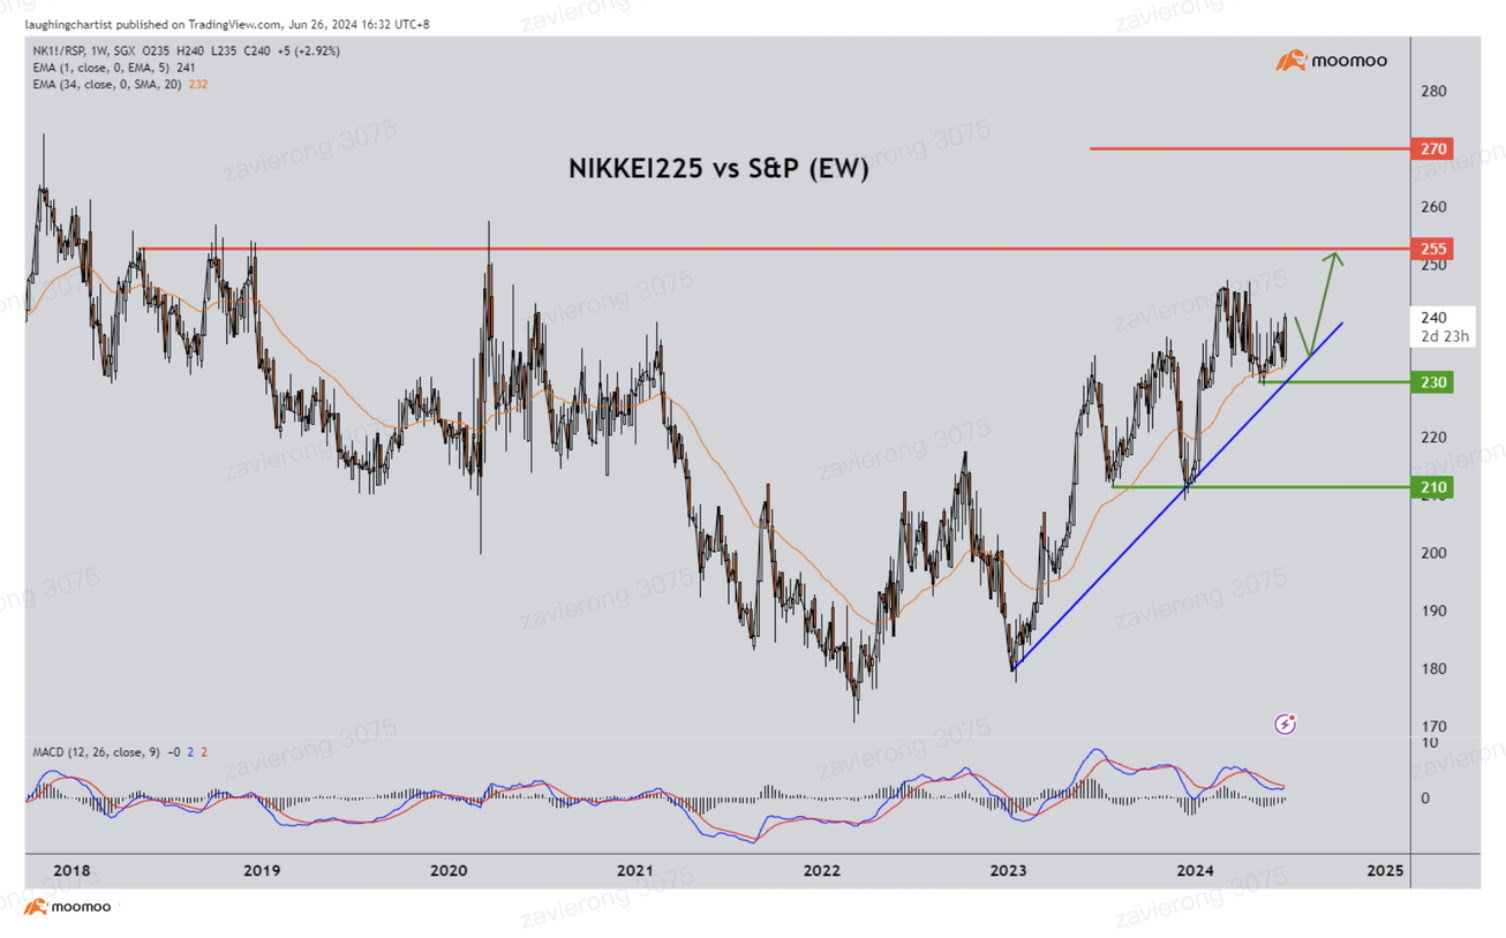
NIKKEI225 vs SPX(EW) (Weekly Chart) - Nikkei225 index is expected to outperform against the S&P (equal-weight) index. The ratio is holding above ascending trendline support with technical indicators advocating for an outperformance scenario. As long as the ratio holds above 230 and is above 34 weeks EMA, a further outperformance of NIKKEI225 index towards 255 and even 270 is expected.
Alternatively: A weekly candlestick close below 230 support will open a Nikkei225 underperformance scenario towards next support at 210.
FX and Rates At A Glance
Key Themes for FX and Rates:
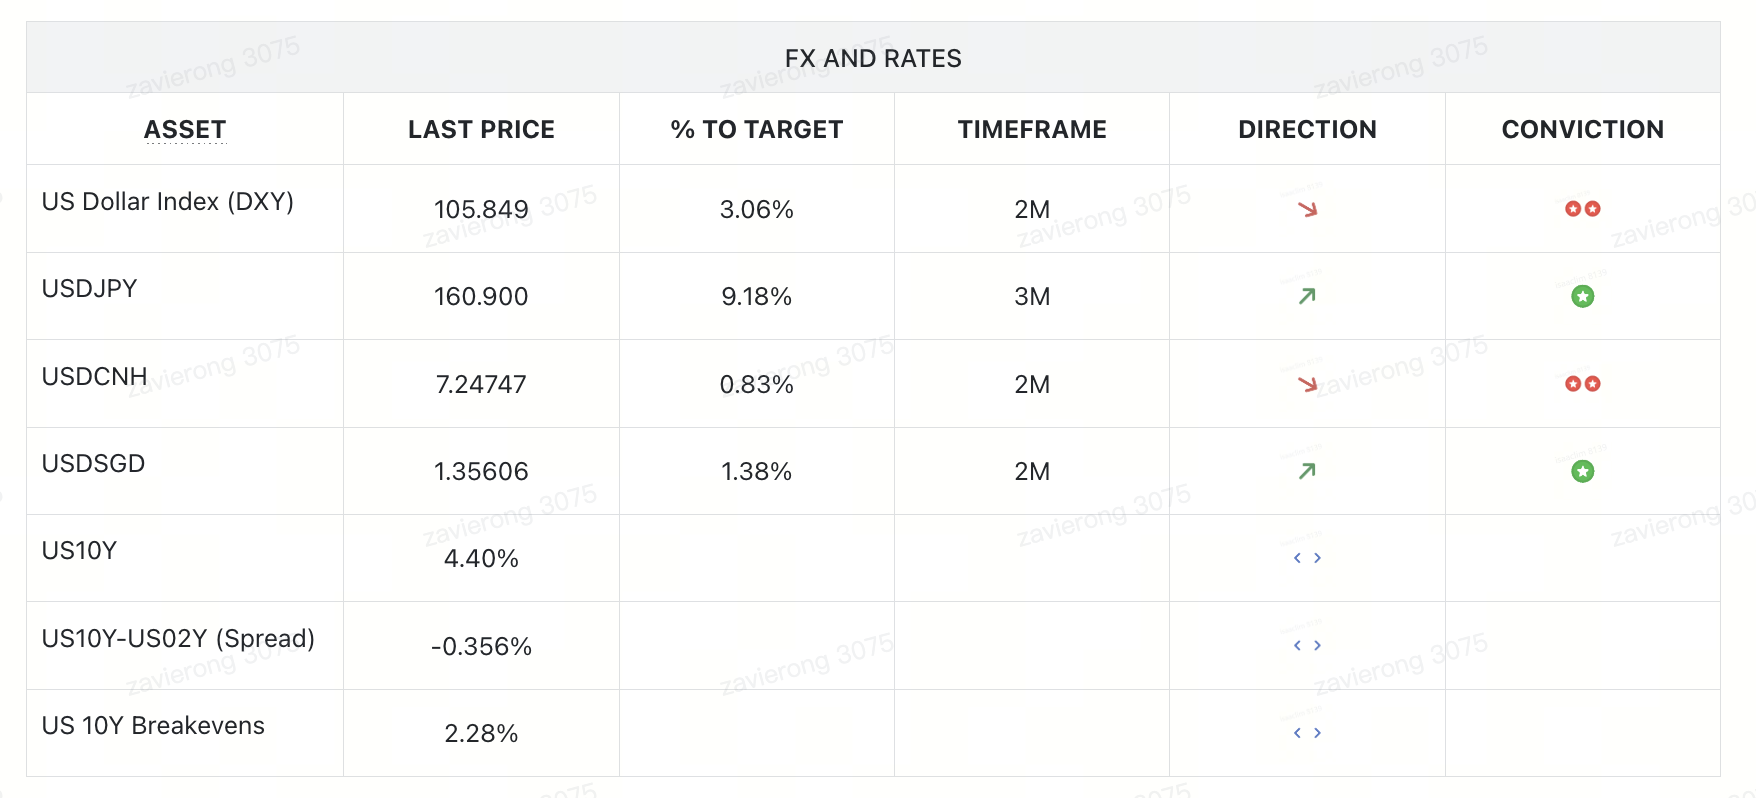
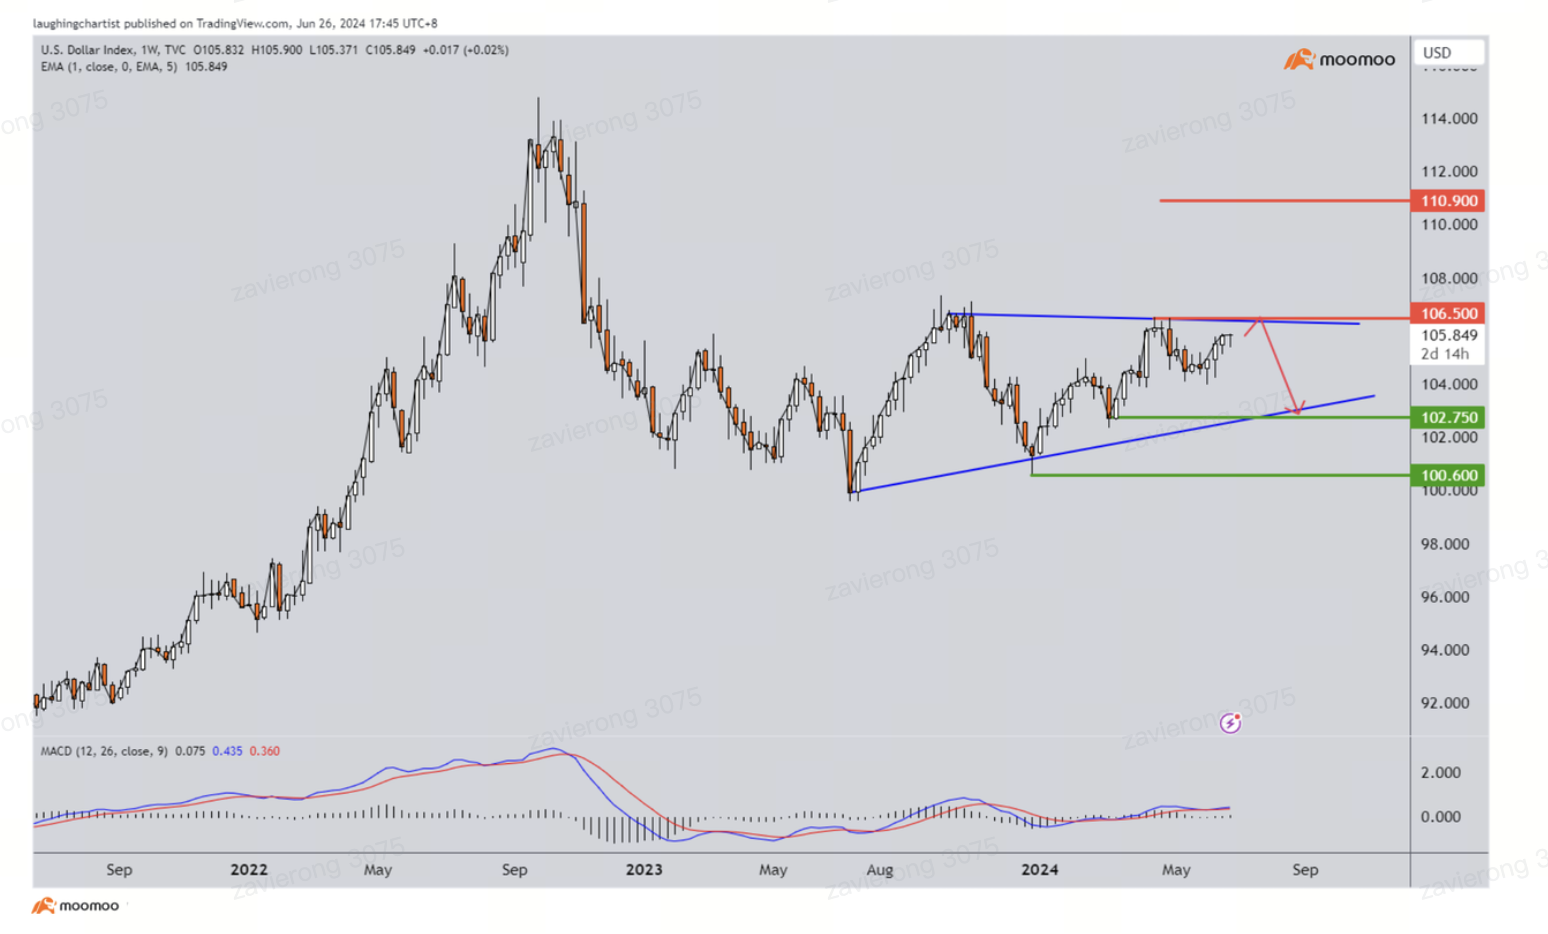
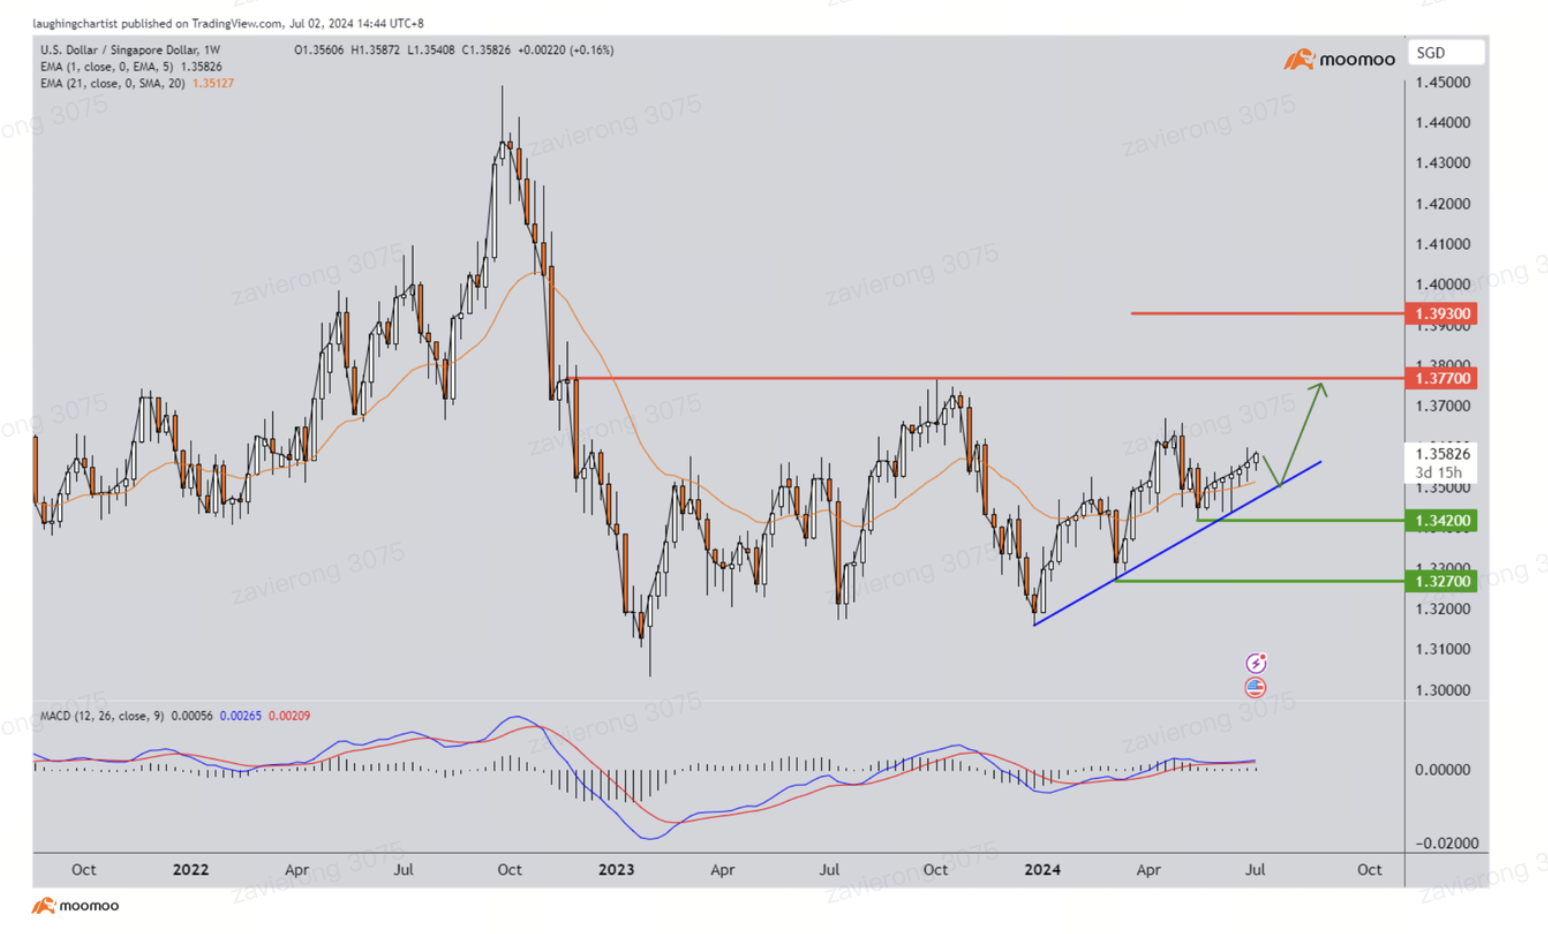
WHEN THE US FED STARTS EASING, FX AND FI WILL FEEL THE HEAT.DXY can expect further weakening, starting a fresh phase of dollar underperformance. As long as rates remain high, investors should continue to hold onto treasury bonds. Once the US Fed starts easing, investors should rotate their capital towards IG bonds to still keep the same rate of returns while minimising downside risks.
INVESTORS SHOULD CONTINUE TO KEEP AN EYE ON THE YIELD CURVE DESPITE THE INVERSION.The yield curve remains inverted for now and the media has not been talking about it. However, history has shown us that a recession and market sell off tends to start once the yield curve steepens and climbs above 0%. While we are not seeing signs of a steepening yet, things could change very quickly should the US Fed start cutting rates.
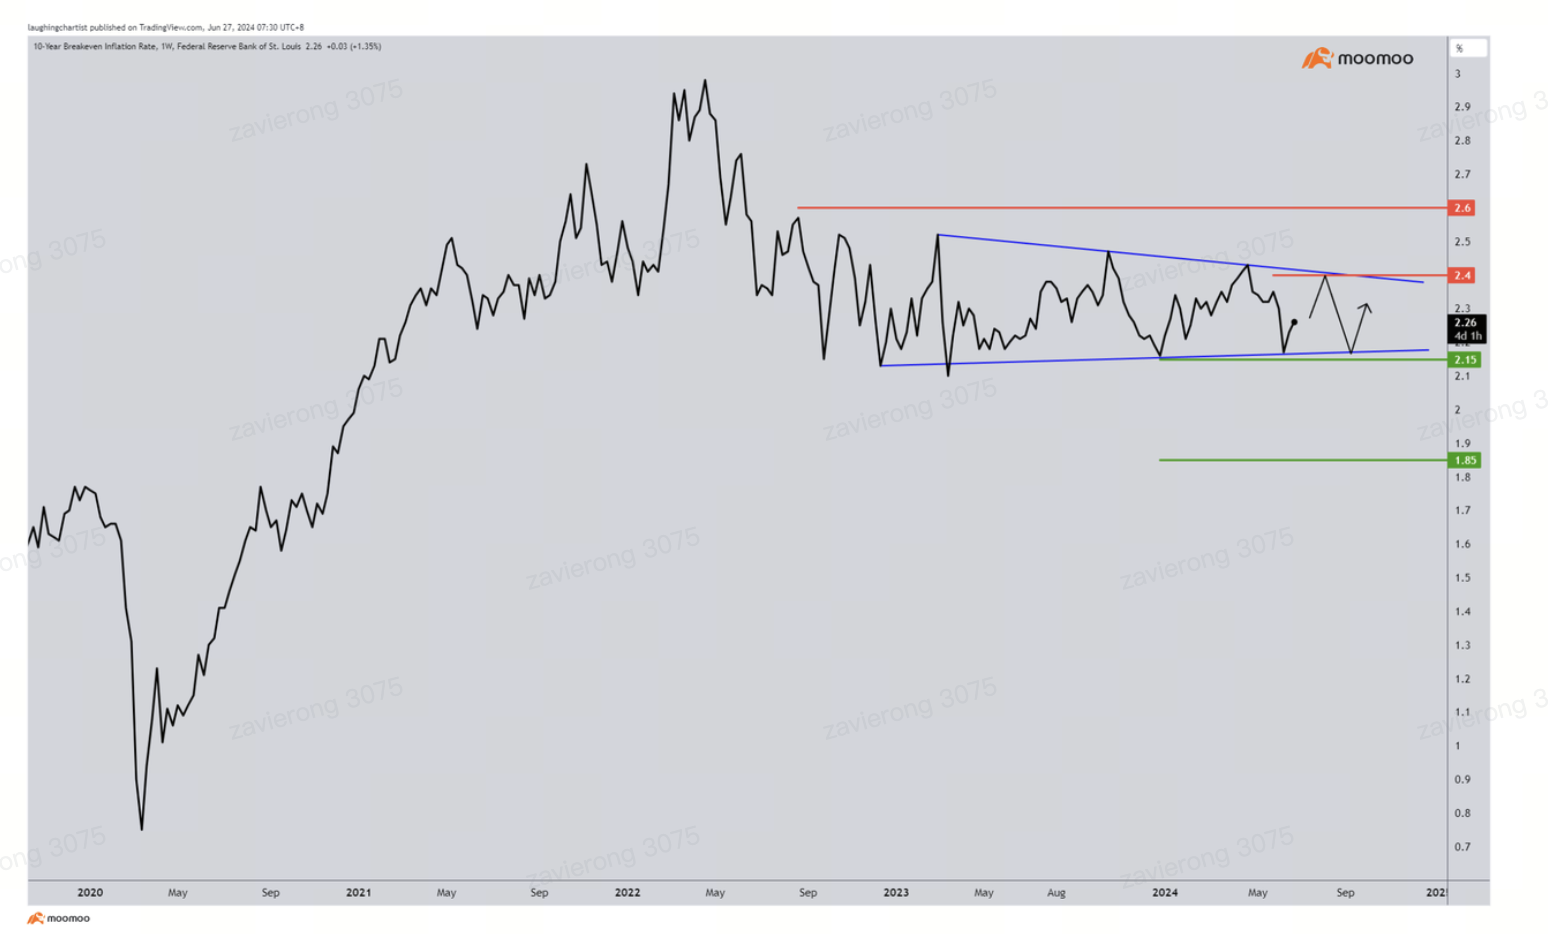
INFLATION IS EXPECTED TO SETTLE HIGHER THAN THE US FED'S TARGET OF 2%.US 10 year breakeven (TIPS) is now consolidating sideways within a range. While inflation is indeed slowing and coming lower, the market is still expecting the long term interest rates in the US to be slightly elevated. We do not expect interest rates to meet the 2% US Fed target. But instead, long term interest rates could settle somewhere between 2.15% and 2.4%.
US Dollar Index (DXY)
USDJPY
USDCNH

USDSGD
US 10 Year Yield (US10Y)
US 10-2 Yield Curve Spreads
US 10-year Breakeven
Commodities At A Glance
Key Themes for Commodities:
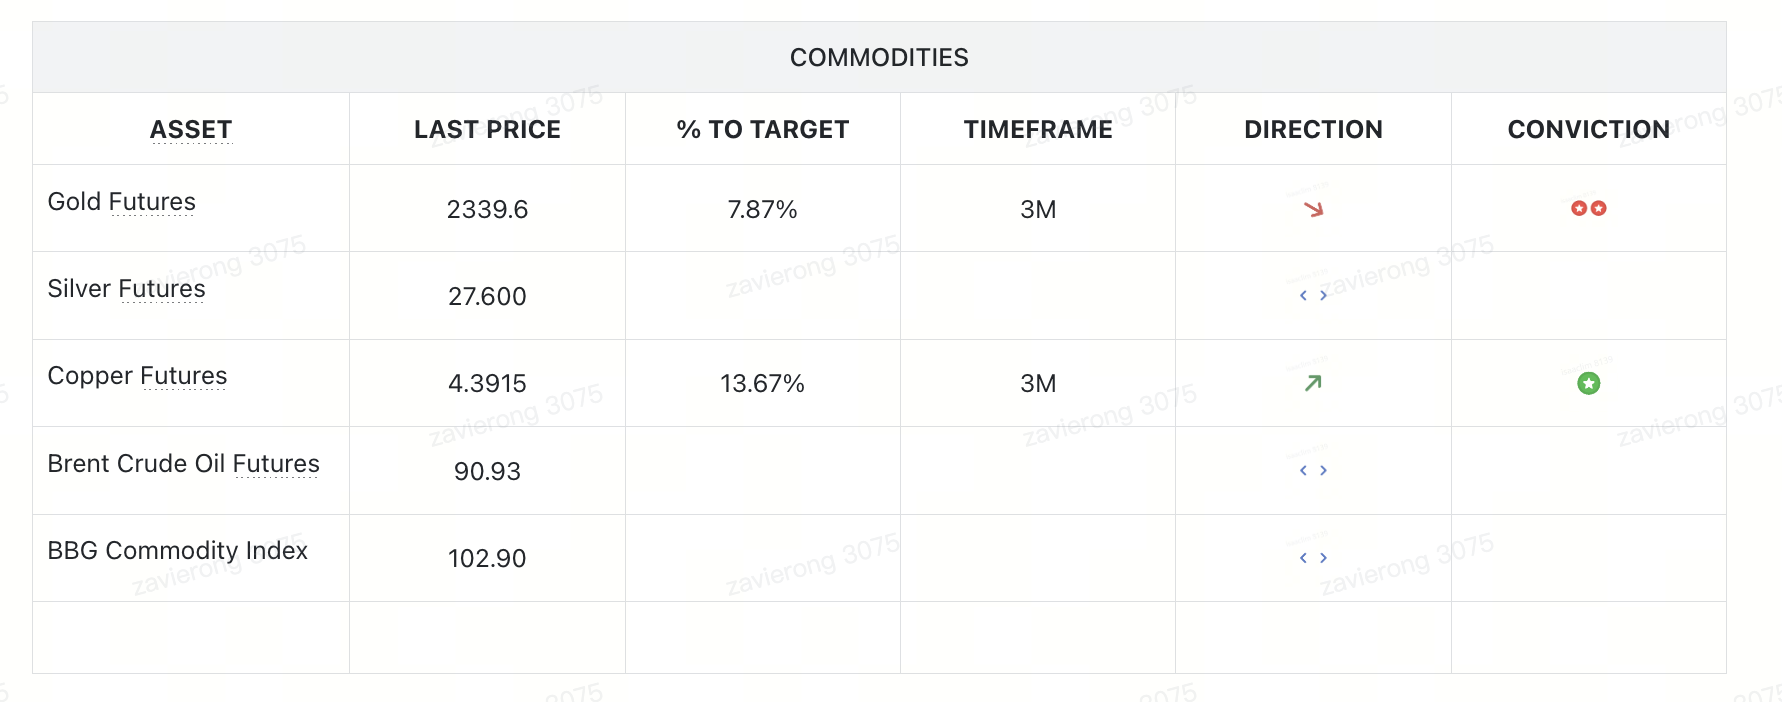
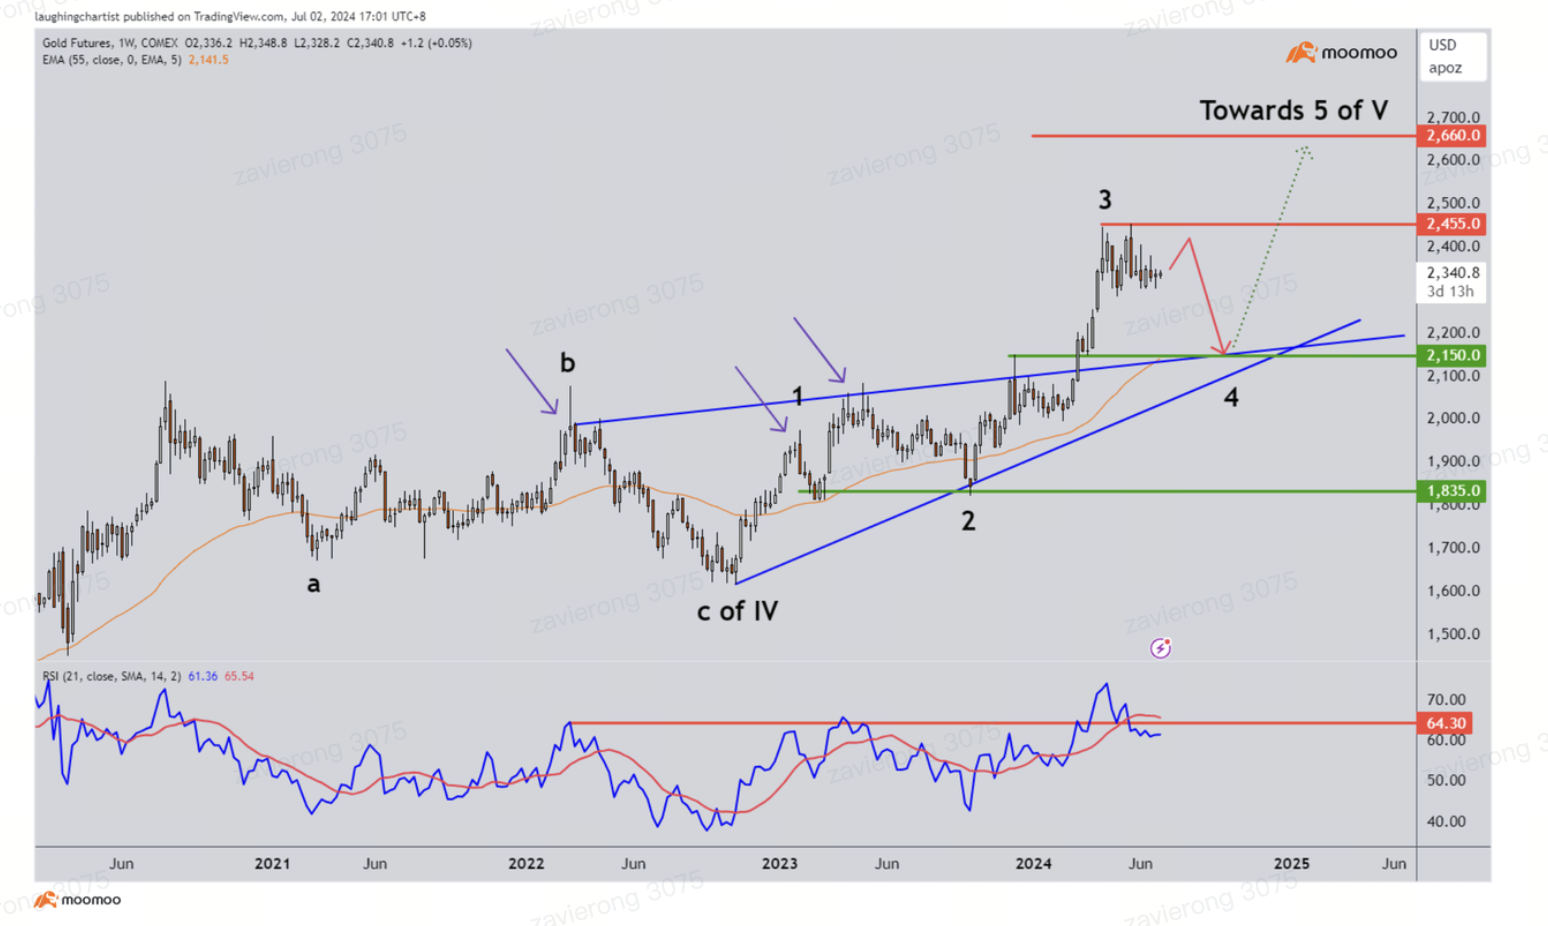
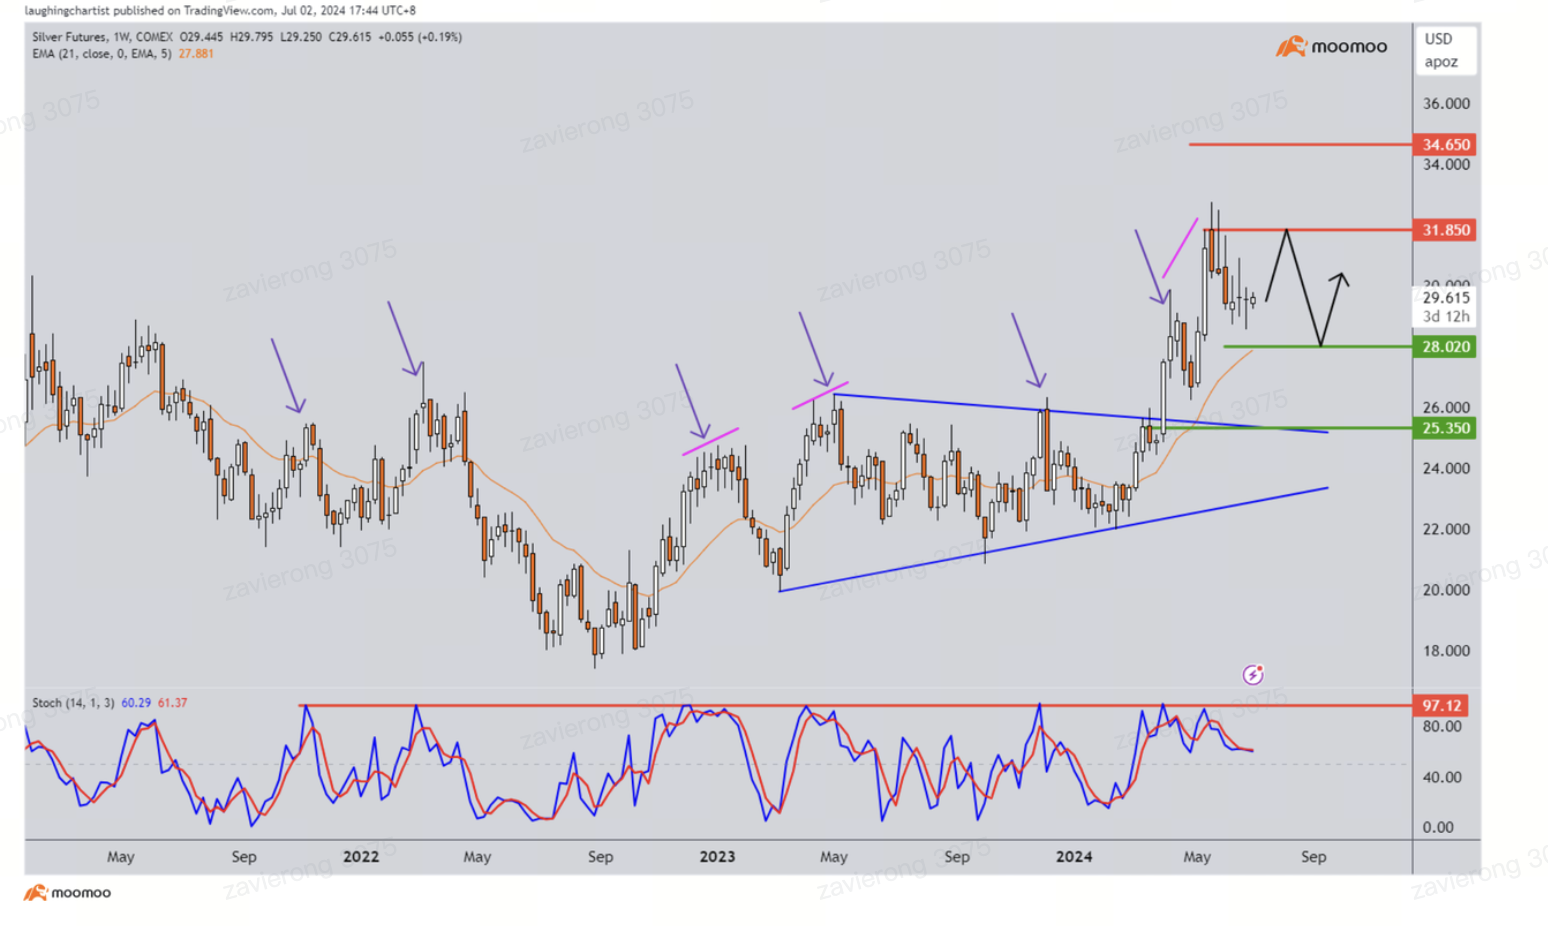
BEWARE THE CYCLICAL DYNAMICS. COMMODITIES LOOK TOPPISH WITH LIMITED UPSIDE AFTER STRONG H1.After a strong rally for the first half of 2024, Gold and Silver prices are now looking toppish with limited upside. While Gold prices may still see demand from central banks, it is already up 14.5% YTD. Similarly, while Silver is still expected to see robust demand from photovoltaic and EV industry, its value has climbed by 29% YTD. We expect the cyclical nature of commodities to dominate at least for the start of H2 2024 before starting another round of fresh rally.
Gold Futures
Silver Futures
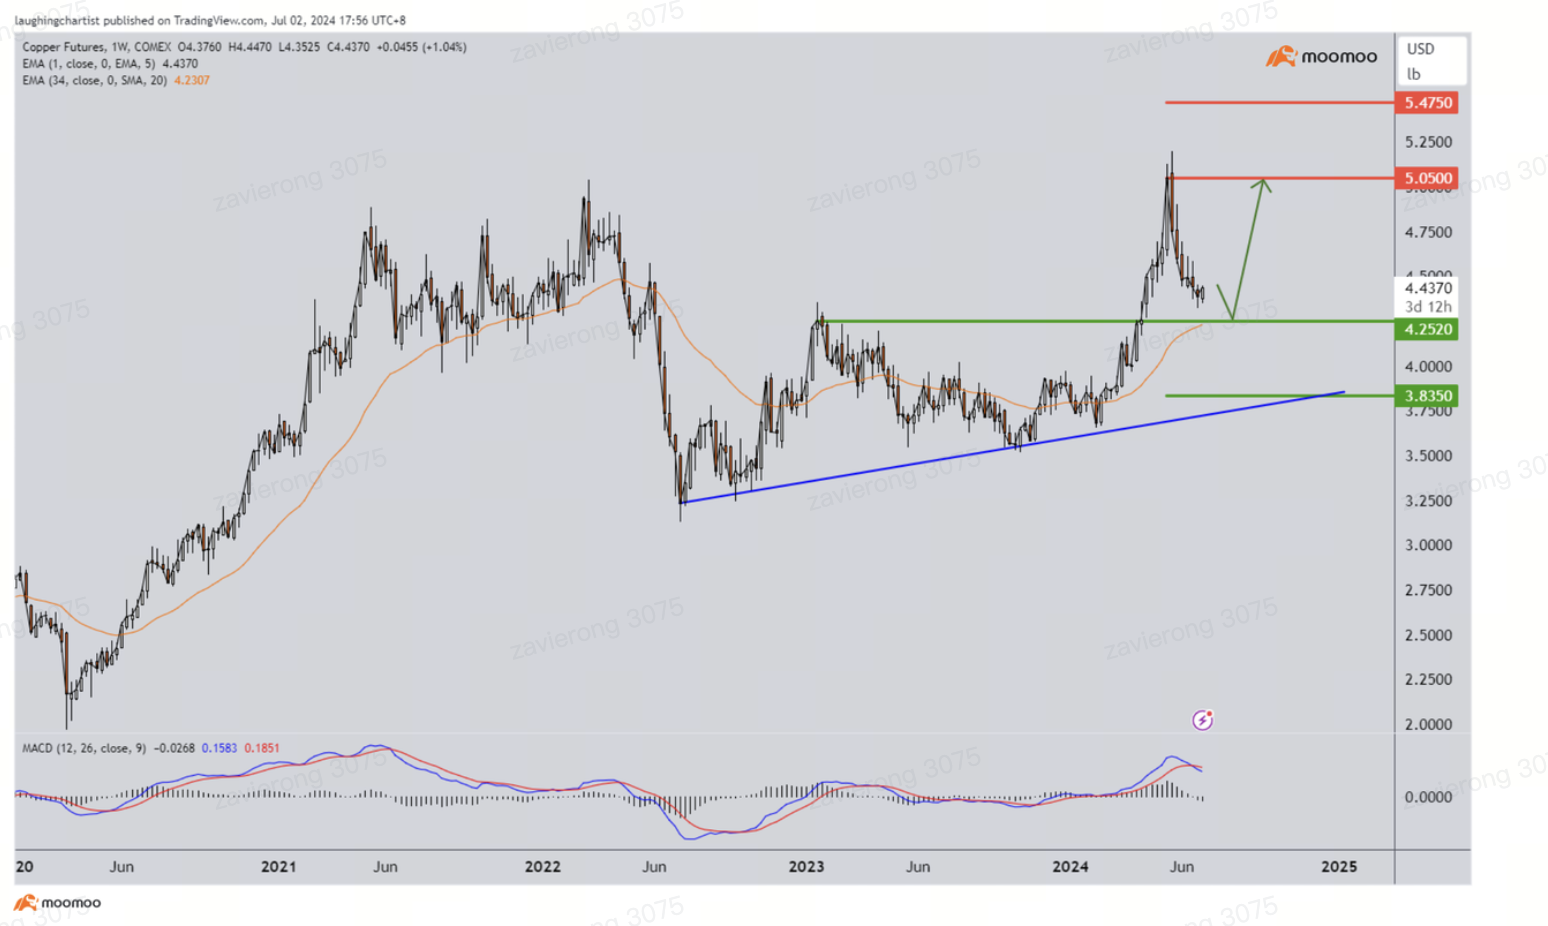
Copper Futures
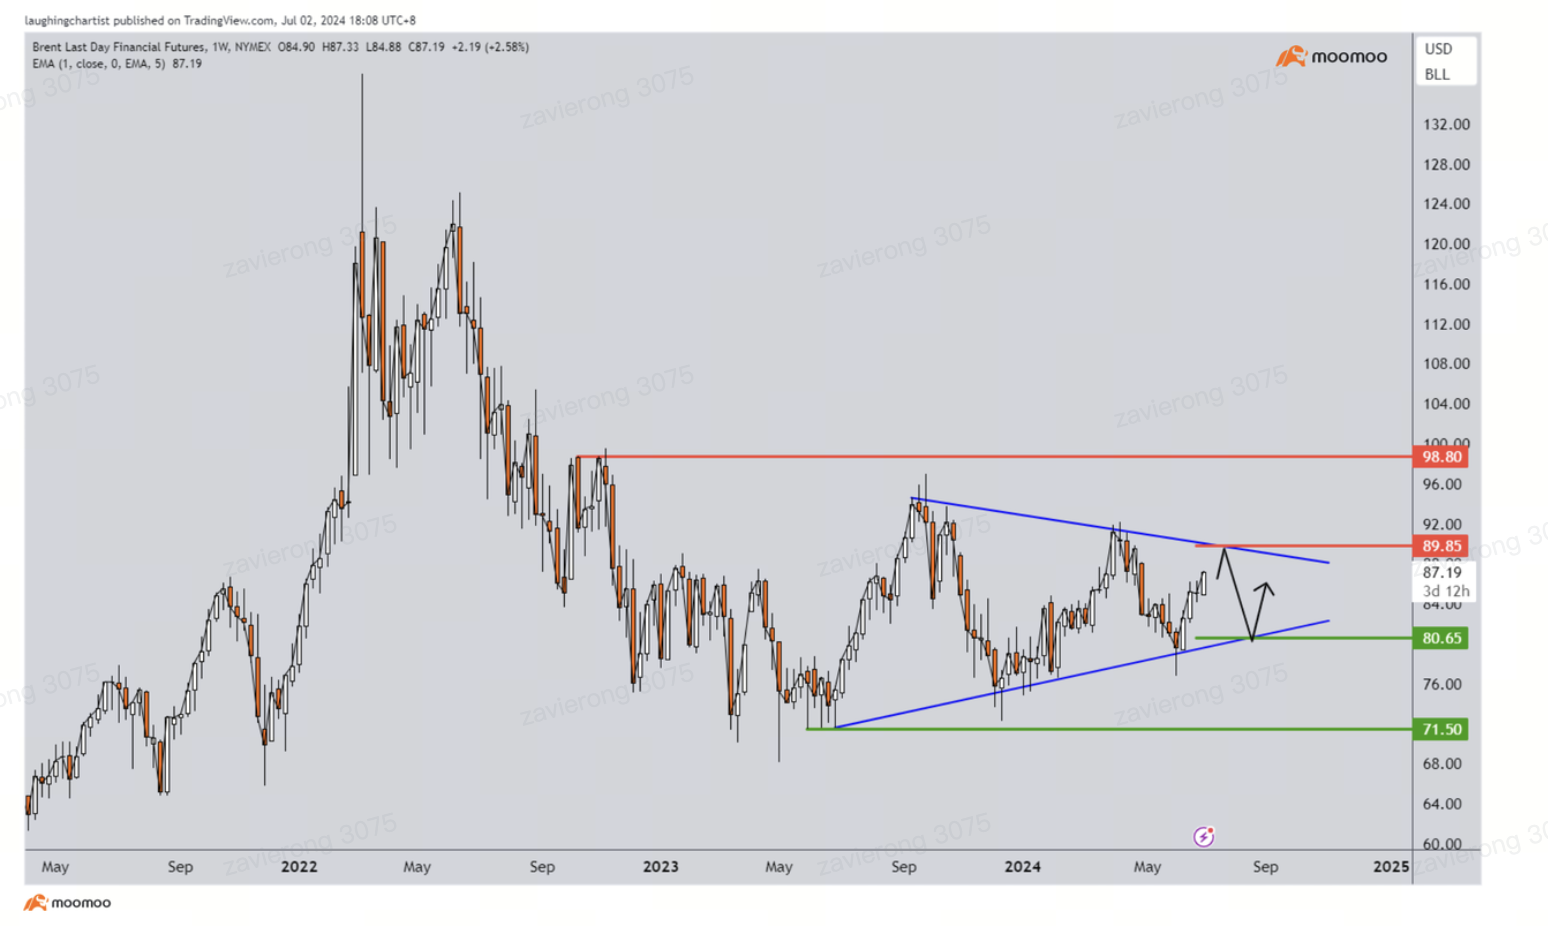
Brent Crude Futures
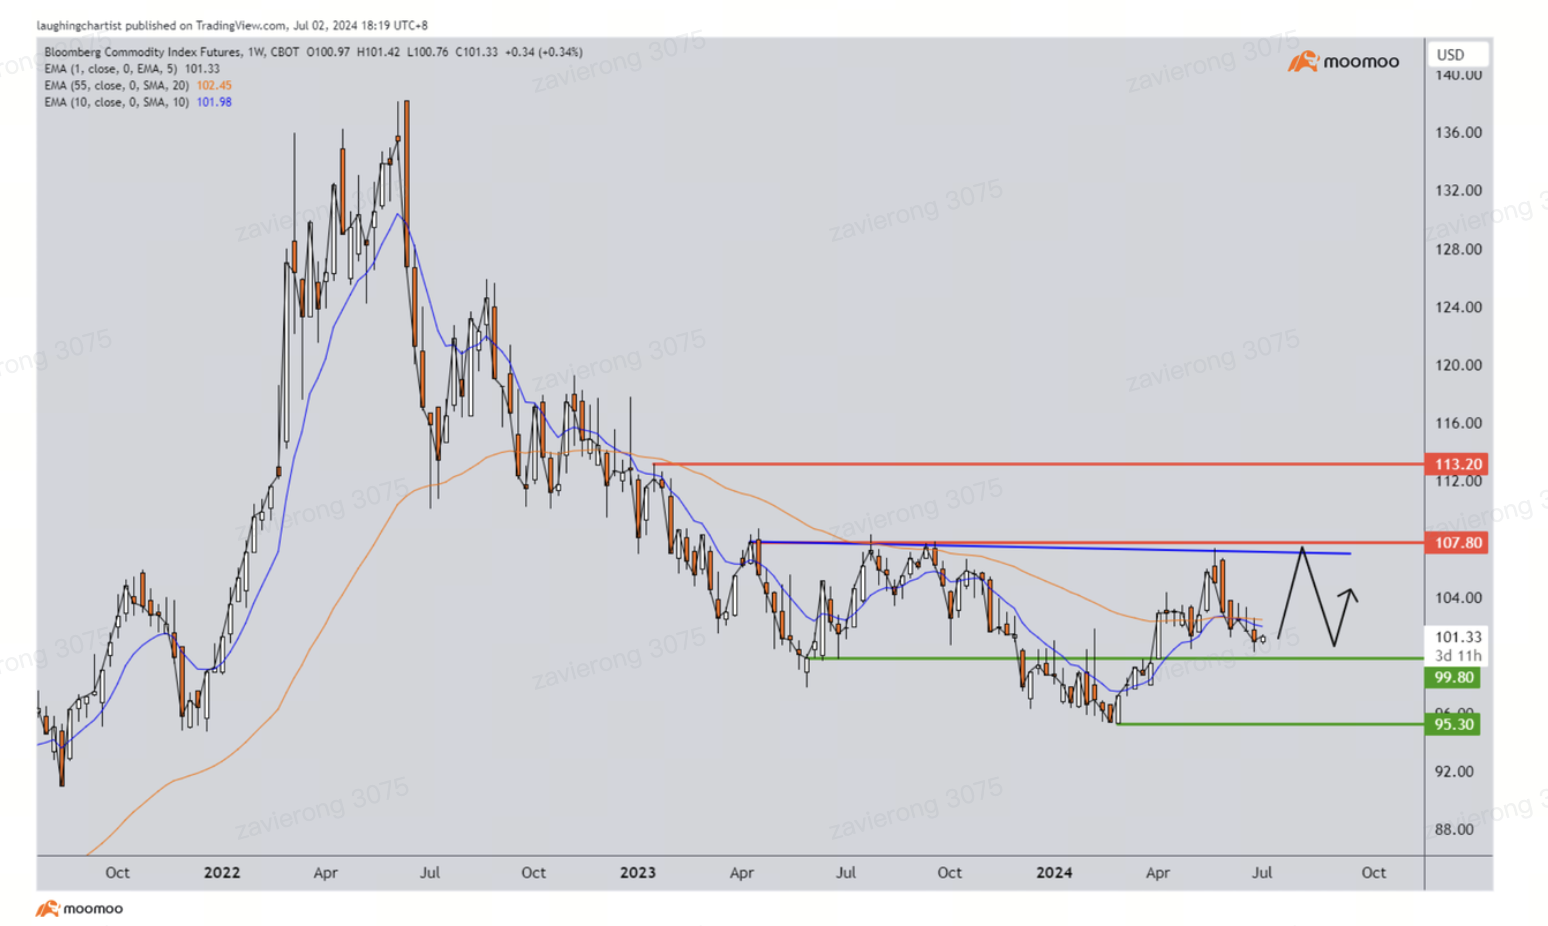
BBG Commodity Index
-
Moomoo Singapore Unveils First Moomoo Stores in Singapore
-- -
Moomoo Singapore Wins Big at Asia Fintech Awards 2025; named WealthTech of the Year and Personal Finance Tech of the Year
-- -
Moomoo Singapore Announces Strategic Partnership with Barings to provide Private Credit Investments to Accredited Investors
--
