How far off is Duke Energy Corporation (NYSE:DUK) from its intrinsic value? Using the most recent financial data, we'll take a look at whether the stock is fairly priced by taking the forecast future cash flows of the company and discounting them back to today's value. We will take advantage of the Discounted Cash Flow (DCF) model for this purpose. Don't get put off by the jargon, the math behind it is actually quite straightforward.
Companies can be valued in a lot of ways, so we would point out that a DCF is not perfect for every situation. If you want to learn more about discounted cash flow, the rationale behind this calculation can be read in detail in the Simply Wall St analysis model.
View our latest analysis for Duke Energy
The Calculation
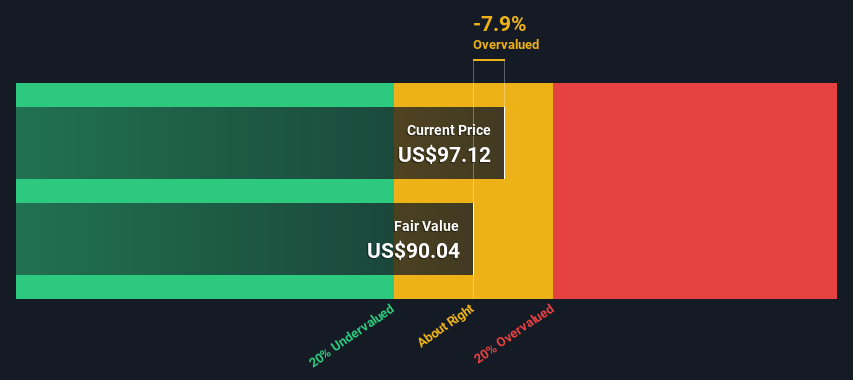
We have to calculate the value of Duke Energy slightly differently to other stocks because it is a electric utilities company. In this approach dividends per share (DPS) are used, as free cash flow is difficult to estimate and often not reported by analysts. This often underestimates the value of a stock, but it can still be good as a comparison to competitors. We use the Gordon Growth Model, which assumes dividend will grow into perpetuity at a rate that can be sustained. For a number of reasons a very conservative growth rate is used that cannot exceed that of a company's Gross Domestic Product (GDP). In this case we used the 5-year average of the 10-year government bond yield (1.9%). The expected dividend per share is then discounted to today's value at a cost of equity of 5.3%. Compared to the current share price of US$97.1, the company appears around fair value at the time of writing. Valuations are imprecise instruments though, rather like a telescope - move a few degrees and end up in a different galaxy. Do keep this in mind.
Value Per Share = Expected Dividend Per Share / (Discount Rate - Perpetual Growth Rate)
= US$4.2 / (5.3% – 1.9%)
= US$90.0

NYSE:DUK Discounted Cash Flow October 5th 2022
The Assumptions
We would point out that the most important inputs to a discounted cash flow are the discount rate and of course the actual cash flows. If you don't agree with these result, have a go at the calculation yourself and play with the assumptions. The DCF also does not consider the possible cyclicality of an industry, or a company's future capital requirements, so it does not give a full picture of a company's potential performance. Given that we are looking at Duke Energy as potential shareholders, the cost of equity is used as the discount rate, rather than the cost of capital (or weighted average cost of capital, WACC) which accounts for debt. In this calculation we've used 5.3%, which is based on a levered beta of 0.800. Beta is a measure of a stock's volatility, compared to the market as a whole. We get our beta from the industry average beta of globally comparable companies, with an imposed limit between 0.8 and 2.0, which is a reasonable range for a stable business.
Next Steps:
Whilst important, the DCF calculation shouldn't be the only metric you look at when researching a company. The DCF model is not a perfect stock valuation tool. Rather it should be seen as a guide to "what assumptions need to be true for this stock to be under/overvalued?" For example, changes in the company's cost of equity or the risk free rate can significantly impact the valuation. For Duke Energy, there are three important items you should explore:
- Risks: For example, we've discovered 3 warning signs for Duke Energy (1 doesn't sit too well with us!) that you should be aware of before investing here.
- Future Earnings: How does DUK's growth rate compare to its peers and the wider market? Dig deeper into the analyst consensus number for the upcoming years by interacting with our free analyst growth expectation chart.
- Other Solid Businesses: Low debt, high returns on equity and good past performance are fundamental to a strong business. Why not explore our interactive list of stocks with solid business fundamentals to see if there are other companies you may not have considered!
PS. Simply Wall St updates its DCF calculation for every American stock every day, so if you want to find the intrinsic value of any other stock just search here.
Have feedback on this article? Concerned about the content? Get in touch with us directly. Alternatively, email editorial-team (at) simplywallst.com.
This article by Simply Wall St is general in nature. We provide commentary based on historical data and analyst forecasts only using an unbiased methodology and our articles are not intended to be financial advice. It does not constitute a recommendation to buy or sell any stock, and does not take account of your objectives, or your financial situation. We aim to bring you long-term focused analysis driven by fundamental data. Note that our analysis may not factor in the latest price-sensitive company announcements or qualitative material. Simply Wall St has no position in any stocks mentioned.
デュークエネルギー会社(ニューヨーク証券取引所コード:DUK)はその内在的価値からどのくらい離れていますか?最新の財務データを使って、会社が予測した将来の現金フローを今日の価値に戻すことで、株の定価が公平かどうかを見てみます。そのため,割引キャッシュフロー(DCF)モデルを利用する.言葉に驚いて逃げないでくださいその背後にある数学は実際にはかなり簡単です
会社の評価には様々な方式が考えられるため,割引キャッシュフローはいずれの場合にも適用できないことを指摘する.キャッシュフローの割引に関する情報をより多く知りたい場合は,この計算の背後にある原理をSimply Wall St.解析モデルで詳細に読むことができる
デュークのエネルギーの最新分析を見てください
計算する
私たちが計算するDuke Energyの価値は他の株とは少し違う。なぜならそれは電力公共事業会社だからだ。この方法では、自由キャッシュフローの推定が困難であるため、1株当たり配当金(DPS)が使用され、アナリストは報告しないことが多い。これは往々にして株の価値を過小評価するが、競争相手に比べて依然として良い。私たちは持続可能な速度で配当金が永久配当金に増加すると仮定するゴードン成長モデルを使用する。いくつかの理由で、非常に保守的な成長率が使用されており、1社の国内総生産(GDP)を超えることはできない。この場合,10年期国債利回りの5年平均値(1.9%)を用いた.そして、1株当たりの配当金が5.3%の配当コストで今日の価値に割引されることを期待する。現在97.1ドルの株価と比較して、同社は本稿を書く際に公正な価値に近いようだ。しかし推定値は不正確なツールであり望遠鏡のように何度移動するかで別の銀河に到達しますこの点を覚えておいてください
1株当たり価値=期待1株当たり配当/(割引率−永久成長率)
=4.2ドル/(5.3%-1.9%)
=90.0ドル
ニューヨーク証券取引所:DUK割引キャッシュフロー2022年10月5日
仮に
割引キャッシュフローの最も重要な投入は割引率であり,もちろん実際のキャッシュフローもあることを指摘する.これらの結果に同意しなければ、自分で計算してみて、仮説をもてあそぶことができます。DCFも業界の可能性の周期性を考慮しておらず、1社の将来の資本要求も考慮していないため、1社の潜在業績の全貌を与えていない。Duke Energyを潜在株主と見なしていることから,債務の資本コスト(あるいは加重平均資本コスト,WACC)を考慮するのではなく,割引率として株式コストを用いている。この計算には5.3%を用いたが,これはレバー率0.800に基づくテスト版である.ベータ係数は市場全体に対する株の変動性を測る指標である。我々のベータ係数は、世界の比較可能会社の業界平均ベータ係数から来ており、0.8から2.0の間に強制的に制限されており、これは安定したビジネスの合理的な範囲である
次のステップ:
重要なのは,ある会社を研究する際に,DCF計算が唯一の測定基準であるべきではないことである。キャッシュフローモデルを割引することは完璧な株式推定ツールではない。逆に、それは“この株が過小評価されたり、過大評価されたりするためには、どのような仮定が成立する必要があるのか”というガイドラインとみなされるべきだ。例えば、会社の権益コストや無リスク金利の変化は推定値に大きな影響を与える可能性がある。デュークエネルギーにとって3つの重要なプロジェクトを探るべきです
- リスク例えば発見されたのはデュークエネルギーの3つの警告信号(%1私たちとの関係はあまり良くありません!)ここに投資する前にあなたはこれを認識しなければならない
- 将来の収益:同業者やより広い市場に比べて、DUKの成長率はどうですか?私たちの無料アナリストの成長予想グラフと相互作用することで、アナリストの今後数年間の共通認識数字をより深く掘り下げる
- 他の堅実な企業:低債務、高株収益率と良好な過去業績は強力な業務の基礎である。なぜ私たちがしっかりしたビジネスのファンダメンタルズを持っている株の相互作用リストを探索して、あなたが考えていないかもしれない他の会社があるかどうかを調べてみませんか
PSSimply Wall St.米国株ごとの割引キャッシュフロー計算を毎日更新するので,他の株の内在的価値を見つけるためには,ここを検索するだけでよい.
この文章に何かフィードバックはありますか。内容が心配ですか。 連絡を取り合う私たちに直接連絡します。あるいは,編集グループに電子メールを送信することも可能であり,アドレスはimplywallst.comである.
本稿ではSimply Wall St.によって作成され,包括的である私たちは歴史データとアナリスト予測に基づくコメントを偏りのない方法で提供するだけで、私たちの文章は財務アドバイスとしてのつもりはありません。それは株を売買する提案にもなりませんし、あなたの目標やあなたの財務状況も考慮していません。私たちの目標はあなたにファンダメンタルデータによって駆動される長期的な重点分析をもたらすことです。私たちの分析は最新の価格に敏感な会社の公告や定性材料を考慮しないかもしれないことに注意してください。Simply Wall St.上記のいずれの株に対しても在庫を持っていない.