

Ying Hai Group Holdings Company Limited (HKG:8668) shareholders would be excited to see that the share price has had a great month, posting a 38% gain and recovering from prior weakness. Not all shareholders will be feeling jubilant, since the share price is still down a very disappointing 10% in the last twelve months.
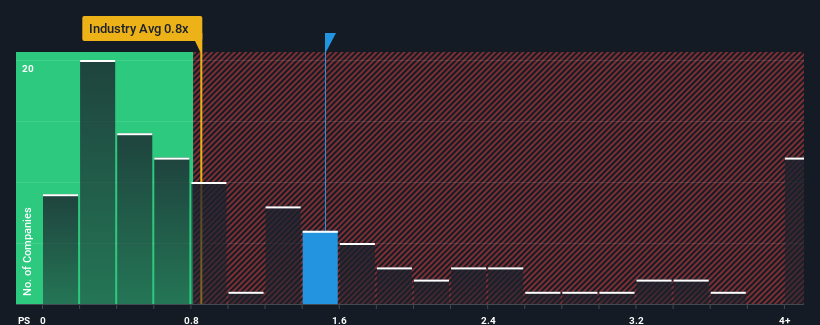
Following the firm bounce in price, given close to half the companies operating in Hong Kong's Hospitality industry have price-to-sales ratios (or "P/S") below 0.8x, you may consider Ying Hai Group Holdings as a stock to potentially avoid with its 1.5x P/S ratio. Nonetheless, we'd need to dig a little deeper to determine if there is a rational basis for the elevated P/S.
How Ying Hai Group Holdings Has Been Performing
Recent times have been quite advantageous for Ying Hai Group Holdings as its revenue has been rising very briskly. It seems that many are expecting the strong revenue performance to beat most other companies over the coming period, which has increased investors' willingness to pay up for the stock. However, if this isn't the case, investors might get caught out paying too much for the stock.
Although there are no analyst estimates available for Ying Hai Group Holdings, take a look at this free data-rich visualisation to see how the company stacks up on earnings, revenue and cash flow.How Is Ying Hai Group Holdings' Revenue Growth Trending?
Ying Hai Group Holdings' P/S ratio would be typical for a company that's expected to deliver solid growth, and importantly, perform better than the industry.
Retrospectively, the last year delivered an explosive gain to the company's top line. Spectacularly, three year revenue growth has also set the world alight, thanks to the last 12 months of incredible growth. So we can start by confirming that the company has done a tremendous job of growing revenue over that time.
Comparing that recent medium-term revenue trajectory with the industry's one-year growth forecast of 20% shows it's noticeably more attractive.
With this in consideration, it's not hard to understand why Ying Hai Group Holdings' P/S is high relative to its industry peers. Presumably shareholders aren't keen to offload something they believe will continue to outmanoeuvre the wider industry.
The Final Word
Ying Hai Group Holdings' P/S is on the rise since its shares have risen strongly. It's argued the price-to-sales ratio is an inferior measure of value within certain industries, but it can be a powerful business sentiment indicator.
We've established that Ying Hai Group Holdings maintains its high P/S on the strength of its recent three-year growth being higher than the wider industry forecast, as expected. In the eyes of shareholders, the probability of a continued growth trajectory is great enough to prevent the P/S from pulling back. Barring any significant changes to the company's ability to make money, the share price should continue to be propped up.
You need to take note of risks, for example - Ying Hai Group Holdings has 4 warning signs (and 2 which are concerning) we think you should know about.
If companies with solid past earnings growth is up your alley, you may wish to see this free collection of other companies with strong earnings growth and low P/E ratios.
Have feedback on this article? Concerned about the content? Get in touch with us directly. Alternatively, email editorial-team (at) simplywallst.com.
This article by Simply Wall St is general in nature. We provide commentary based on historical data and analyst forecasts only using an unbiased methodology and our articles are not intended to be financial advice. It does not constitute a recommendation to buy or sell any stock, and does not take account of your objectives, or your financial situation. We aim to bring you long-term focused analysis driven by fundamental data. Note that our analysis may not factor in the latest price-sensitive company announcements or qualitative material. Simply Wall St has no position in any stocks mentioned.