
Investors in Shenergy (SHSE:600642) Have Seen Favorable Returns of 40% Over the Past Five Years
Investors in Shenergy (SHSE:600642) Have Seen Favorable Returns of 40% Over the Past Five Years
If you buy and hold a stock for many years, you'd hope to be making a profit. But more than that, you probably want to see it rise more than the market average. But Shenergy Company Limited (SHSE:600642) has fallen short of that second goal, with a share price rise of 18% over five years, which is below the market return. The last year hasn't been great either, with the stock up just 2.6%.
如果你购买并持有股票多年,你希望获利。但更重要的是,你可能希望看到它的上涨幅度超过市场平均水平。但是申能有限公司(SHSE:600642)没有实现第二个目标,股价在五年内上涨了18%,低于市场回报率。去年也不是很好,该股仅上涨了2.6%。
So let's assess the underlying fundamentals over the last 5 years and see if they've moved in lock-step with shareholder returns.
因此,让我们评估过去5年的基本面,看看它们是否与股东回报步调一致。
Check out our latest analysis for Shenergy
查看我们对申能的最新分析
While markets are a powerful pricing mechanism, share prices reflect investor sentiment, not just underlying business performance. One flawed but reasonable way to assess how sentiment around a company has changed is to compare the earnings per share (EPS) with the share price.
虽然市场是一种强大的定价机制,但股价反映了投资者的情绪,而不仅仅是潜在的业务表现。评估公司情绪变化的一种有缺陷但合理的方法是将每股收益(EPS)与股价进行比较。
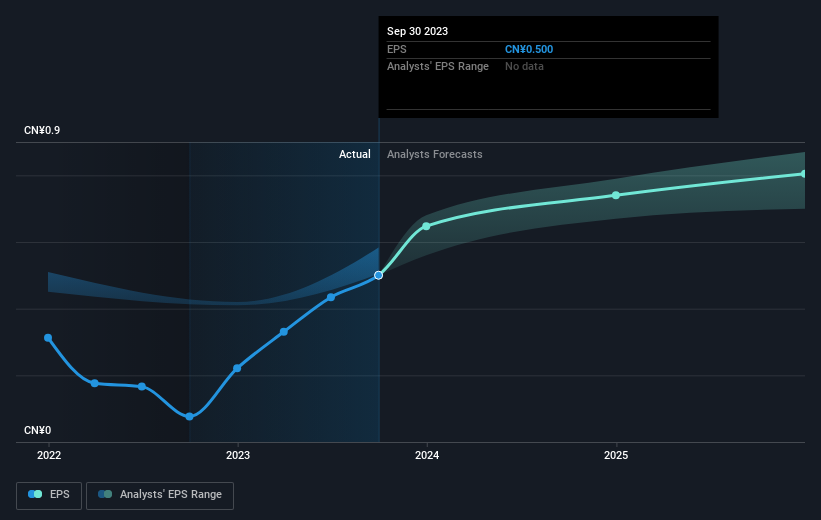
Over half a decade, Shenergy managed to grow its earnings per share at 8.3% a year. The EPS growth is more impressive than the yearly share price gain of 3% over the same period. So one could conclude that the broader market has become more cautious towards the stock. This cautious sentiment is reflected in its (fairly low) P/E ratio of 11.87.
在过去的五年中,Shenergy成功地将其每股收益增长了8.3%。每股收益的增长比同期3%的年股价涨幅更令人印象深刻。因此,可以得出结论,整个市场对该股变得更加谨慎。这种谨慎的情绪反映在其(相当低的)市盈率为11.87。
The graphic below depicts how EPS has changed over time (unveil the exact values by clicking on the image).
下图描述了 EPS 随着时间的推移是如何变化的(点击图片可以看到确切的值)。
We know that Shenergy has improved its bottom line lately, but is it going to grow revenue? Check if analysts think Shenergy will grow revenue in the future.
我们知道Shenergy最近提高了利润,但它会增加收入吗?查看分析师是否认为Shenergy将来会增加收入。
What About Dividends?
分红呢?
As well as measuring the share price return, investors should also consider the total shareholder return (TSR). Whereas the share price return only reflects the change in the share price, the TSR includes the value of dividends (assuming they were reinvested) and the benefit of any discounted capital raising or spin-off. It's fair to say that the TSR gives a more complete picture for stocks that pay a dividend. As it happens, Shenergy's TSR for the last 5 years was 40%, which exceeds the share price return mentioned earlier. This is largely a result of its dividend payments!
除了衡量股价回报外,投资者还应考虑股东总回报(TSR)。股价回报仅反映股价的变化,而股东总回报率包括股息的价值(假设股息已被再投资)以及任何折扣融资或分拆的收益。可以公平地说,股东总回报率为支付股息的股票提供了更完整的画面。碰巧的是,申能在过去5年的股东总回报率为40%,超过了前面提到的股价回报率。这在很大程度上是其股息支付的结果!
A Different Perspective
不同的视角
It's nice to see that Shenergy shareholders have received a total shareholder return of 5.2% over the last year. And that does include the dividend. However, that falls short of the 7% TSR per annum it has made for shareholders, each year, over five years. While it is well worth considering the different impacts that market conditions can have on the share price, there are other factors that are even more important. Even so, be aware that Shenergy is showing 2 warning signs in our investment analysis , and 1 of those is a bit unpleasant...
很高兴看到申能股东在去年获得了5.2%的股东总回报率。这确实包括股息。但是,这还低于其在五年内每年为股东设定的7%的股东总回报率。尽管值得考虑市场状况可能对股价产生的不同影响,但还有其他因素更为重要。即便如此,请注意,Shenergy在我们的投资分析中显示了两个警告信号,其中一个有点令人不快...
Of course, you might find a fantastic investment by looking elsewhere. So take a peek at this free list of companies we expect will grow earnings.
当然,通过寻找其他地方,你可能会找到一笔不错的投资。因此,请看一下我们预计收益将增加的这份免费公司名单。
Please note, the market returns quoted in this article reflect the market weighted average returns of stocks that currently trade on Chinese exchanges.
请注意,本文引用的市场回报反映了目前在中国交易所交易的股票的市场加权平均回报。
Have feedback on this article? Concerned about the content? Get in touch with us directly. Alternatively, email editorial-team (at) simplywallst.com.
This article by Simply Wall St is general in nature. We provide commentary based on historical data and analyst forecasts only using an unbiased methodology and our articles are not intended to be financial advice. It does not constitute a recommendation to buy or sell any stock, and does not take account of your objectives, or your financial situation. We aim to bring you long-term focused analysis driven by fundamental data. Note that our analysis may not factor in the latest price-sensitive company announcements or qualitative material. Simply Wall St has no position in any stocks mentioned.
对这篇文章有反馈吗?对内容感到担忧?直接联系我们。 或者,给编辑团队 (at) simplywallst.com 发送电子邮件。
Simply Wall St的这篇文章本质上是笼统的。我们仅使用公正的方法根据历史数据和分析师的预测提供评论,我们的文章无意作为财务建议。它不构成买入或卖出任何股票的建议,也没有考虑到您的目标或财务状况。我们的目标是为您提供由基本数据驱动的长期重点分析。请注意,我们的分析可能不考虑最新的价格敏感型公司公告或定性材料。简而言之,华尔街没有持有任何上述股票的头寸。