
Zhuguang Holdings Group (HKG:1176 Investor Five-year Losses Grow to 74% as the Stock Sheds HK$470m This Past Week
Zhuguang Holdings Group (HKG:1176 Investor Five-year Losses Grow to 74% as the Stock Sheds HK$470m This Past Week
We're definitely into long term investing, but some companies are simply bad investments over any time frame. It hits us in the gut when we see fellow investors suffer a loss. For example, we sympathize with anyone who was caught holding Zhuguang Holdings Group Company Limited (HKG:1176) during the five years that saw its share price drop a whopping 75%. We also note that the stock has performed poorly over the last year, with the share price down 47%. The falls have accelerated recently, with the share price down 32% in the last three months.
我们肯定喜欢长期投资,但有些公司在任何时间段内都只是不良投资。当我们看到其他投资者蒙受损失时,我们就会大吃一惊。例如,我们对任何在珠光控股集团有限公司(HKG: 1176)股价暴跌75%的五年中被抓到持有珠光控股集团有限公司(HKG: 1176)的人表示同情。我们还注意到,该股去年表现不佳,股价下跌了47%。最近,跌幅加快,股价在过去三个月中下跌了32%。
After losing 16% this past week, it's worth investigating the company's fundamentals to see what we can infer from past performance.
在上周下跌16%之后,值得调查该公司的基本面,看看我们可以从过去的表现中推断出什么。
See our latest analysis for Zhuguang Holdings Group
查看我们对珠光控股集团的最新分析
While markets are a powerful pricing mechanism, share prices reflect investor sentiment, not just underlying business performance. One flawed but reasonable way to assess how sentiment around a company has changed is to compare the earnings per share (EPS) with the share price.
虽然市场是一种强大的定价机制,但股价反映了投资者的情绪,而不仅仅是潜在的业务表现。评估公司情绪变化的一种有缺陷但合理的方法是将每股收益(EPS)与股价进行比较。
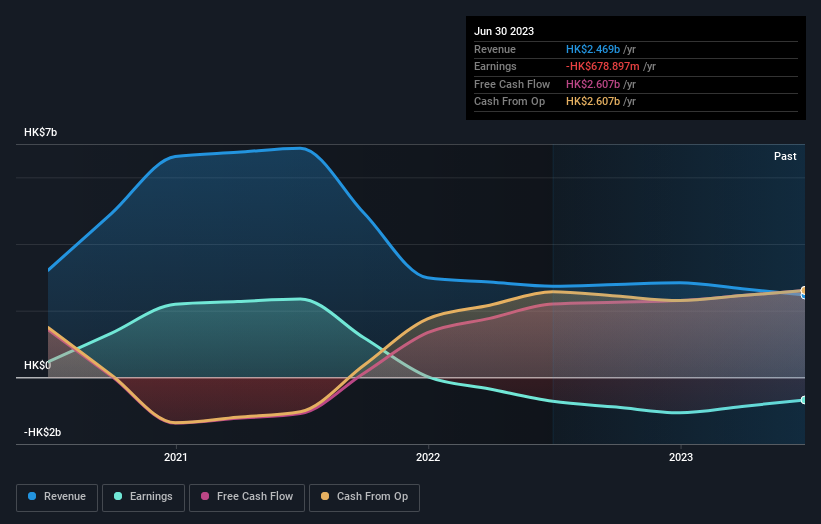
We know that Zhuguang Holdings Group has been profitable in the past. On the other hand, it reported a trailing twelve months loss, suggesting it isn't reliably profitable. Other metrics might give us a better handle on how its value is changing over time.
我们知道珠光控股集团过去一直盈利。另一方面,该公司报告了过去十二个月的亏损,这表明它并不能可靠地盈利。其他指标可能会让我们更好地了解其价值如何随着时间的推移而变化。
The revenue decline of 0.7% isn't too bad. But it's quite possible the market had expected better; a closer look at the revenue trends might explain the pessimism.
0.7%的收入下降还算不错。但很有可能市场原本预期会好转;仔细观察收入趋势可能会解释这种悲观情绪。
You can see how earnings and revenue have changed over time in the image below (click on the chart to see the exact values).
您可以在下图中看到收入和收入随时间推移而发生的变化(点击图表查看确切值)。
You can see how its balance sheet has strengthened (or weakened) over time in this free interactive graphic.
您可以在这张免费的交互式图片中看到其资产负债表如何随着时间的推移而增强(或减弱)。
A Different Perspective
不同的视角
We regret to report that Zhuguang Holdings Group shareholders are down 47% for the year. Unfortunately, that's worse than the broader market decline of 3.4%. However, it could simply be that the share price has been impacted by broader market jitters. It might be worth keeping an eye on the fundamentals, in case there's a good opportunity. Unfortunately, last year's performance may indicate unresolved challenges, given that it was worse than the annualised loss of 12% over the last half decade. Generally speaking long term share price weakness can be a bad sign, though contrarian investors might want to research the stock in hope of a turnaround. It's always interesting to track share price performance over the longer term. But to understand Zhuguang Holdings Group better, we need to consider many other factors. To that end, you should be aware of the 3 warning signs we've spotted with Zhuguang Holdings Group .
我们遗憾地报告,珠光控股集团的股东今年下跌了47%。不幸的是,这比大盘下跌3.4%还要严重。但是,可能仅仅是股价受到了更广泛的市场紧张情绪的影响。如果有很好的机会,可能值得关注基本面。不幸的是,去年的表现可能表明挑战尚未得到解决,因为这比过去五年来12%的年化亏损还要严重。总的来说,长期股价疲软可能是一个坏兆头,尽管逆势投资者可能希望研究该股,希望出现转机。从长远来看,追踪股价表现总是很有意思的。但是,要更好地了解珠光控股集团,我们需要考虑许多其他因素。为此,您应该注意我们在珠光控股集团发现的3个警告信号。
If you would prefer to check out another company -- one with potentially superior financials -- then do not miss this free list of companies that have proven they can grow earnings.
如果你想看看另一家公司——一家财务状况可能优异的公司——那么千万不要错过这份已经证明自己可以增加收益的公司的免费名单。
Please note, the market returns quoted in this article reflect the market weighted average returns of stocks that currently trade on Hong Kong exchanges.
请注意,本文引用的市场回报反映了目前在香港交易所交易的股票的市场加权平均回报。
Have feedback on this article? Concerned about the content? Get in touch with us directly. Alternatively, email editorial-team (at) simplywallst.com.
This article by Simply Wall St is general in nature. We provide commentary based on historical data and analyst forecasts only using an unbiased methodology and our articles are not intended to be financial advice. It does not constitute a recommendation to buy or sell any stock, and does not take account of your objectives, or your financial situation. We aim to bring you long-term focused analysis driven by fundamental data. Note that our analysis may not factor in the latest price-sensitive company announcements or qualitative material. Simply Wall St has no position in any stocks mentioned.
对这篇文章有反馈吗?对内容感到担忧?直接联系我们。 或者,给编辑团队 (at) simplywallst.com 发送电子邮件。
Simply Wall St的这篇文章本质上是笼统的。我们仅使用公正的方法根据历史数据和分析师的预测提供评论,我们的文章无意作为财务建议。它不构成买入或卖出任何股票的建议,也没有考虑到您的目标或财务状况。我们的目标是为您提供由基本数据驱动的长期重点分析。请注意,我们的分析可能不考虑最新的价格敏感型公司公告或定性材料。简而言之,华尔街没有持有任何上述股票的头寸。