
-
市场
-
产品
-
资讯
-
Moo社区
-
课堂
-
查看更多
-
功能介绍
-
费用费用透明,无最低余额限制
投资选择、功能介绍、费用相关信息由Moomoo Financial Inc.提供
- English
- 中文繁體
- 中文简体
- 深色
- 浅色
Food Empire Holdings' (SGX:F03) Three-year Earnings Growth Trails the 36% YoY Shareholder Returns
Food Empire Holdings' (SGX:F03) Three-year Earnings Growth Trails the 36% YoY Shareholder Returns
It might seem bad, but the worst that can happen when you buy a stock (without leverage) is that its share price goes to zero. But if you buy shares in a really great company, you can more than double your money. For instance the Food Empire Holdings Limited (SGX:F03) share price is 126% higher than it was three years ago. That sort of return is as solid as granite. On top of that, the share price is up 62% in about a quarter.
On the back of a solid 7-day performance, let's check what role the company's fundamentals have played in driving long term shareholder returns.
View our latest analysis for Food Empire Holdings
While markets are a powerful pricing mechanism, share prices reflect investor sentiment, not just underlying business performance. By comparing earnings per share (EPS) and share price changes over time, we can get a feel for how investor attitudes to a company have morphed over time.
During three years of share price growth, Food Empire Holdings achieved compound earnings per share growth of 32% per year. Notably, the 31% average annual share price gain matches up nicely with the EPS growth rate. This suggests that sentiment and expectations have not changed drastically. Quite to the contrary, the share price has arguably reflected the EPS growth.
You can see how EPS has changed over time in the image below (click on the chart to see the exact values).
We know that Food Empire Holdings has improved its bottom line over the last three years, but what does the future have in store? This free interactive report on Food Empire Holdings' balance sheet strength is a great place to start, if you want to investigate the stock further.
What About Dividends?
It is important to consider the total shareholder return, as well as the share price return, for any given stock. The TSR is a return calculation that accounts for the value of cash dividends (assuming that any dividend received was reinvested) and the calculated value of any discounted capital raisings and spin-offs. Arguably, the TSR gives a more comprehensive picture of the return generated by a stock. As it happens, Food Empire Holdings' TSR for the last 3 years was 152%, which exceeds the share price return mentioned earlier. And there's no prize for guessing that the dividend payments largely explain the divergence!
A Different Perspective
It's good to see that Food Empire Holdings has rewarded shareholders with a total shareholder return of 109% in the last twelve months. And that does include the dividend. That's better than the annualised return of 12% over half a decade, implying that the company is doing better recently. Someone with an optimistic perspective could view the recent improvement in TSR as indicating that the business itself is getting better with time. While it is well worth considering the different impacts that market conditions can have on the share price, there are other factors that are even more important. For instance, we've identified 3 warning signs for Food Empire Holdings (1 shouldn't be ignored) that you should be aware of.
If you like to buy stocks alongside management, then you might just love this free list of companies. (Hint: insiders have been buying them).
Please note, the market returns quoted in this article reflect the market weighted average returns of stocks that currently trade on Singaporean exchanges.
Have feedback on this article? Concerned about the content? Get in touch with us directly. Alternatively, email editorial-team (at) simplywallst.com.
This article by Simply Wall St is general in nature. We provide commentary based on historical data and analyst forecasts only using an unbiased methodology and our articles are not intended to be financial advice. It does not constitute a recommendation to buy or sell any stock, and does not take account of your objectives, or your financial situation. We aim to bring you long-term focused analysis driven by fundamental data. Note that our analysis may not factor in the latest price-sensitive company announcements or qualitative material. Simply Wall St has no position in any stocks mentioned.
It might seem bad, but the worst that can happen when you buy a stock (without leverage) is that its share price goes to zero. But if you buy shares in a really great company, you can more than double your money. For instance the Food Empire Holdings Limited (SGX:F03) share price is 126% higher than it was three years ago. That sort of return is as solid as granite. On top of that, the share price is up 62% in about a quarter.
这可能看起来很糟糕,但是当你买入一只股票(没有杠杆作用)时可能发生的最糟糕的情况是它的股价变为零。但是,如果你购买一家非常棒的公司的股票,你可以 更多 比你的钱翻一倍。例如 美食帝国控股有限公司 (SGX: F03) 的股价比三年前上涨了126%。这种回报就像花岗岩一样坚固。最重要的是,股价在大约一个季度内上涨了62%。
On the back of a solid 7-day performance, let's check what role the company's fundamentals have played in driving long term shareholder returns.
在连续7天表现稳健的背景下,让我们来看看公司的基本面在推动长期股东回报方面发挥了什么作用。
View our latest analysis for Food Empire Holdings
查看我们对食物帝国控股的最新分析
While markets are a powerful pricing mechanism, share prices reflect investor sentiment, not just underlying business performance. By comparing earnings per share (EPS) and share price changes over time, we can get a feel for how investor attitudes to a company have morphed over time.
虽然市场是一种强大的定价机制,但股价反映了投资者的情绪,而不仅仅是潜在的业务表现。通过比较每股收益(EPS)和一段时间内的股价变化,我们可以了解投资者对公司的态度是如何随着时间的推移而变化的。
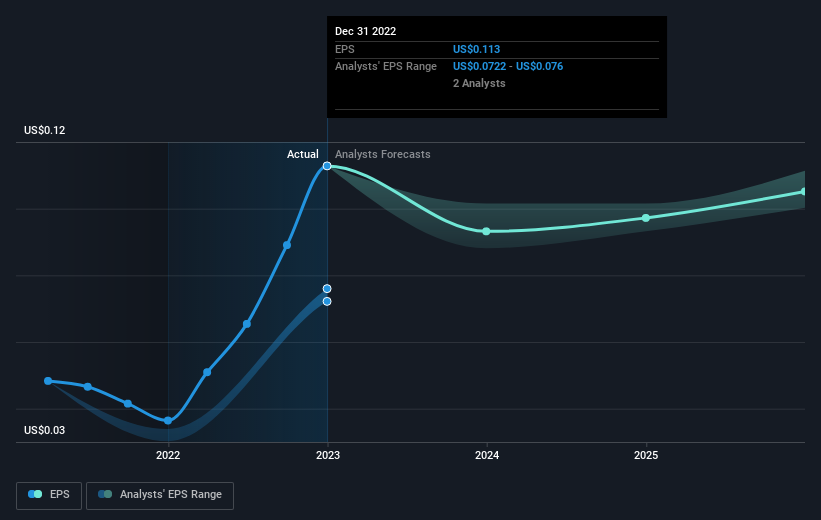
During three years of share price growth, Food Empire Holdings achieved compound earnings per share growth of 32% per year. Notably, the 31% average annual share price gain matches up nicely with the EPS growth rate. This suggests that sentiment and expectations have not changed drastically. Quite to the contrary, the share price has arguably reflected the EPS growth.
在三年的股价增长中,Food Empire Holdings实现了每年32%的复合每股收益增长。值得注意的是,31%的年平均股价涨幅与每股收益的增长率非常吻合。这表明情绪和预期并未发生重大变化。恰恰相反,股价可以说反映了每股收益的增长。
You can see how EPS has changed over time in the image below (click on the chart to see the exact values).
您可以在下图中看到 EPS 随时间推移的变化(点击图表查看确切值)。
We know that Food Empire Holdings has improved its bottom line over the last three years, but what does the future have in store? This free interactive report on Food Empire Holdings' balance sheet strength is a great place to start, if you want to investigate the stock further.
我们知道Food Empire Holdings在过去三年中提高了利润,但是未来会怎样?这个 免费的 如果你想进一步调查该股,关于Food Empire Holdings资产负债表实力的互动报告是一个不错的起点。
What About Dividends?
那股息呢?
It is important to consider the total shareholder return, as well as the share price return, for any given stock. The TSR is a return calculation that accounts for the value of cash dividends (assuming that any dividend received was reinvested) and the calculated value of any discounted capital raisings and spin-offs. Arguably, the TSR gives a more comprehensive picture of the return generated by a stock. As it happens, Food Empire Holdings' TSR for the last 3 years was 152%, which exceeds the share price return mentioned earlier. And there's no prize for guessing that the dividend payments largely explain the divergence!
重要的是要考虑任何给定股票的股东总回报以及股价回报率。股东总回报率是一种回报计算方法,它考虑了现金分红的价值(假设收到的任何股息都是再投资)以及任何折扣资本筹集和分拆的计算值。可以说,TSR更全面地描述了股票产生的回报。碰巧的是,Food Empire Holdings在过去3年的股东总回报率为152%,超过了前面提到的股价回报率。而且,猜测股息支付在很大程度上解释了这种分歧是没有好处的!
A Different Perspective
不同的视角
It's good to see that Food Empire Holdings has rewarded shareholders with a total shareholder return of 109% in the last twelve months. And that does include the dividend. That's better than the annualised return of 12% over half a decade, implying that the company is doing better recently. Someone with an optimistic perspective could view the recent improvement in TSR as indicating that the business itself is getting better with time. While it is well worth considering the different impacts that market conditions can have on the share price, there are other factors that are even more important. For instance, we've identified 3 warning signs for Food Empire Holdings (1 shouldn't be ignored) that you should be aware of.
很高兴看到Food Empire Holdings在过去十二个月中向股东奖励了109%的股东总回报率。这确实包括股息。这比五年来12%的年化回报率要好,这意味着该公司最近表现更好。持乐观态度的人可以将最近TSR的改善视为业务本身随着时间的推移而变得越来越好。尽管值得考虑市场状况可能对股价产生的不同影响,但还有其他更为重要的因素。例如,我们已经确定了 食物帝国控股公司的 3 个警告标志 (1 不应该被忽略),你应该注意。
If you like to buy stocks alongside management, then you might just love this free list of companies. (Hint: insiders have been buying them).
如果你想与管理层一起买入股票,那么你可能会喜欢这个 免费的 公司名单。(提示:内部人士一直在购买它们)。
Please note, the market returns quoted in this article reflect the market weighted average returns of stocks that currently trade on Singaporean exchanges.
请注意,本文引用的市场回报反映了目前在新加坡交易所交易的股票的市场加权平均回报。
Have feedback on this article? Concerned about the content? Get in touch with us directly. Alternatively, email editorial-team (at) simplywallst.com.
This article by Simply Wall St is general in nature. We provide commentary based on historical data and analyst forecasts only using an unbiased methodology and our articles are not intended to be financial advice. It does not constitute a recommendation to buy or sell any stock, and does not take account of your objectives, or your financial situation. We aim to bring you long-term focused analysis driven by fundamental data. Note that our analysis may not factor in the latest price-sensitive company announcements or qualitative material. Simply Wall St has no position in any stocks mentioned.
对这篇文章有反馈吗?对内容感到担忧? 取得联系 直接和我们联系。 或者,给编辑团队 (at) simplywallst.com 发送电子邮件。
Simply Wall St 的这篇文章本质上是一般性的。 我们仅使用不偏不倚的方法根据历史数据和分析师预测提供评论,我们的文章并非旨在提供财务建议。 它不构成买入或卖出任何股票的建议,也没有考虑您的目标或财务状况。我们的目标是为您提供由基本面数据驱动的长期重点分析。请注意,我们的分析可能未将最新的价格敏感型公司公告或定性材料考虑在内。简而言之,华尔街对上述任何股票都没有头寸。
moomoo是Moomoo Technologies Inc.公司提供的金融信息和交易应用程序。
在美国,moomoo上的投资产品和服务由Moomoo Financial Inc.提供,一家受美国证券交易委员会(SEC)监管的持牌主体。 Moomoo Financial Inc.是金融业监管局(FINRA)和证券投资者保护公司(SIPC)的成员。
在新加坡,moomoo上的投资产品和服务是通过Moomoo Financial Singapore Pte. Ltd.提供,该公司受新加坡金融管理局(MAS)监管(牌照号码︰CMS101000) ,持有资本市场服务牌照 (CMS) ,持有财务顾问豁免(Exempt Financial Adviser)资质。本内容未经新加坡金融管理局的审查。
在澳大利亚,moomoo上的金融产品和服务是通过Futu Securities (Australia) Ltd提供,该公司是受澳大利亚证券和投资委员会(ASIC)监管的澳大利亚金融服务许可机构(AFSL No. 224663)。请阅读并理解我们的《金融服务指南》、《条款与条件》、《隐私政策》和其他披露文件,这些文件可在我们的网站 https://www.moomoo.com/au中获取。
在加拿大,通过moomoo应用提供的仅限订单执行的券商服务由Moomoo Financial Canada Inc.提供,并受加拿大投资监管机构(CIRO)监管。
在马来西亚,moomoo上的投资产品和服务是通过Moomoo Securities Malaysia Sdn. Bhd. 提供,该公司受马来西亚证券监督委员会(SC)监管(牌照号码︰eCMSL/A0397/2024) ,持有资本市场服务牌照 (CMSL) 。本内容未经马来西亚证券监督委员会的审查。
Moomoo Technologies Inc., Moomoo Financial Inc., Moomoo Financial Singapore Pte. Ltd., Futu Securities (Australia) Ltd, Moomoo Financial Canada Inc.,和Moomoo Securities Malaysia Sdn. Bhd.是关联公司。
风险及免责提示
moomoo是Moomoo Technologies Inc.公司提供的金融信息和交易应用程序。
在美国,moomoo上的投资产品和服务由Moomoo Financial Inc.提供,一家受美国证券交易委员会(SEC)监管的持牌主体。 Moomoo Financial Inc.是金融业监管局(FINRA)和证券投资者保护公司(SIPC)的成员。
在新加坡,moomoo上的投资产品和服务是通过Moomoo Financial Singapore Pte. Ltd.提供,该公司受新加坡金融管理局(MAS)监管(牌照号码︰CMS101000) ,持有资本市场服务牌照 (CMS) ,持有财务顾问豁免(Exempt Financial Adviser)资质。本内容未经新加坡金融管理局的审查。
在澳大利亚,moomoo上的金融产品和服务是通过Futu Securities (Australia) Ltd提供,该公司是受澳大利亚证券和投资委员会(ASIC)监管的澳大利亚金融服务许可机构(AFSL No. 224663)。请阅读并理解我们的《金融服务指南》、《条款与条件》、《隐私政策》和其他披露文件,这些文件可在我们的网站 https://www.moomoo.com/au中获取。
在加拿大,通过moomoo应用提供的仅限订单执行的券商服务由Moomoo Financial Canada Inc.提供,并受加拿大投资监管机构(CIRO)监管。
在马来西亚,moomoo上的投资产品和服务是通过Moomoo Securities Malaysia Sdn. Bhd. 提供,该公司受马来西亚证券监督委员会(SC)监管(牌照号码︰eCMSL/A0397/2024) ,持有资本市场服务牌照 (CMSL) 。本内容未经马来西亚证券监督委员会的审查。
Moomoo Technologies Inc., Moomoo Financial Inc., Moomoo Financial Singapore Pte. Ltd., Futu Securities (Australia) Ltd, Moomoo Financial Canada Inc.,和Moomoo Securities Malaysia Sdn. Bhd.是关联公司。
- 分享到weixin
- 分享到qq
- 分享到facebook
- 分享到twitter
- 分享到微博
- 粘贴板
使用浏览器的分享功能,分享给你的好友吧