
-
市场
-
产品
-
资讯
-
Moo社区
-
课堂
-
查看更多
-
功能介绍
-
费用费用透明,无最低余额限制
投资选择、功能介绍、费用相关信息由Moomoo Financial Inc.提供
- English
- 中文繁體
- 中文简体
- 深色
- 浅色
Regal Rexnord's (NYSE:RRX) Investors Will Be Pleased With Their Decent 93% Return Over the Last Five Years
Regal Rexnord's (NYSE:RRX) Investors Will Be Pleased With Their Decent 93% Return Over the Last Five Years
Generally speaking the aim of active stock picking is to find companies that provide returns that are superior to the market average. And in our experience, buying the right stocks can give your wealth a significant boost. For example, long term Regal Rexnord Corporation (NYSE:RRX) shareholders have enjoyed a 73% share price rise over the last half decade, well in excess of the market return of around 37% (not including dividends).
With that in mind, it's worth seeing if the company's underlying fundamentals have been the driver of long term performance, or if there are some discrepancies.
Check out our latest analysis for Regal Rexnord
There is no denying that markets are sometimes efficient, but prices do not always reflect underlying business performance. One flawed but reasonable way to assess how sentiment around a company has changed is to compare the earnings per share (EPS) with the share price.
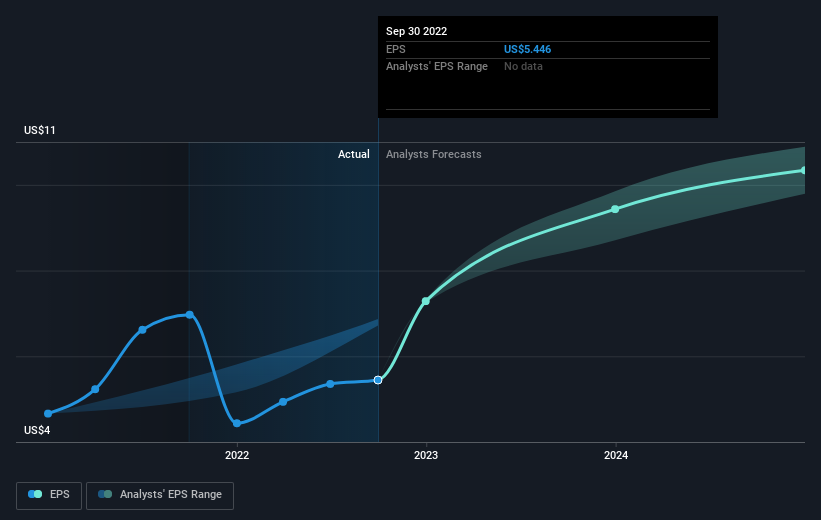
Over half a decade, Regal Rexnord managed to grow its earnings per share at 3.5% a year. This EPS growth is lower than the 12% average annual increase in the share price. So it's fair to assume the market has a higher opinion of the business than it did five years ago. That's not necessarily surprising considering the five-year track record of earnings growth.
The graphic below depicts how EPS has changed over time (unveil the exact values by clicking on the image).
Dive deeper into Regal Rexnord's key metrics by checking this interactive graph of Regal Rexnord's earnings, revenue and cash flow.
What About Dividends?
It is important to consider the total shareholder return, as well as the share price return, for any given stock. Whereas the share price return only reflects the change in the share price, the TSR includes the value of dividends (assuming they were reinvested) and the benefit of any discounted capital raising or spin-off. Arguably, the TSR gives a more comprehensive picture of the return generated by a stock. As it happens, Regal Rexnord's TSR for the last 5 years was 93%, which exceeds the share price return mentioned earlier. The dividends paid by the company have thusly boosted the total shareholder return.
A Different Perspective
While the broader market lost about 7.9% in the twelve months, Regal Rexnord shareholders did even worse, losing 13% (even including dividends). Having said that, it's inevitable that some stocks will be oversold in a falling market. The key is to keep your eyes on the fundamental developments. On the bright side, long term shareholders have made money, with a gain of 14% per year over half a decade. It could be that the recent sell-off is an opportunity, so it may be worth checking the fundamental data for signs of a long term growth trend. If you would like to research Regal Rexnord in more detail then you might want to take a look at whether insiders have been buying or selling shares in the company.
Of course, you might find a fantastic investment by looking elsewhere. So take a peek at this free list of companies we expect will grow earnings.
Please note, the market returns quoted in this article reflect the market weighted average returns of stocks that currently trade on US exchanges.
Have feedback on this article? Concerned about the content? Get in touch with us directly. Alternatively, email editorial-team (at) simplywallst.com.
This article by Simply Wall St is general in nature. We provide commentary based on historical data and analyst forecasts only using an unbiased methodology and our articles are not intended to be financial advice. It does not constitute a recommendation to buy or sell any stock, and does not take account of your objectives, or your financial situation. We aim to bring you long-term focused analysis driven by fundamental data. Note that our analysis may not factor in the latest price-sensitive company announcements or qualitative material. Simply Wall St has no position in any stocks mentioned.
一般来说,主动选股的目的是找到那些提供高于市场平均水平的回报的公司。根据我们的经验,购买合适的股票可以显著增加你的财富。例如,长期富豪雷克斯诺公司(纽约证券交易所股票代码:RRX)的股东在过去五年中股价上涨了73%,远远超过了约37%的市场回报率(不包括股息)。
考虑到这一点,值得关注的是,该公司的潜在基本面是长期业绩的驱动力,还是存在一些差异。
查看我们对富豪雷克斯诺的最新分析
不可否认,市场有时是有效的,但价格并不总是反映潜在的商业表现。评估围绕一家公司的情绪变化的一个有缺陷但合理的方法是将每股收益(EPS)与股价进行比较。
在过去的五年里,帝王力士乐的每股收益以每年3.5%的速度增长。这一每股收益增幅低于该公司股价12%的年均增幅。因此,可以公平地认为,市场对这项业务的看法比五年前更高。考虑到五年来盈利增长的记录,这并不一定令人惊讶。
下图描述了EPS是如何随着时间的推移而变化的(通过单击图像来揭示确切的值)。
通过查看这张Regal Rexnord收益、收入和现金流的互动图表,更深入地了解Regal Rexnord的关键指标。
那股息呢?
重要的是要考虑任何给定股票的总股东回报以及股价回报。虽然股价回报只反映股价的变动,但TSR包括股息的价值(假设股息再投资),以及任何折价集资或分拆所带来的利益。可以说,TSR更全面地描绘了一只股票产生的回报。碰巧的是,富豪雷克斯诺过去5年的总回报率为93%,超过了前面提到的股价回报率。该公司支付的股息因此提振了总计股东回报。
不同的视角
虽然大盘在过去12个月里下跌了约7.9%,但富豪雷克斯诺的股东表现更糟,下跌了13%(甚至包括股息)。话虽如此,在下跌的市场中,一些股票不可避免地会被超卖。关键是要密切关注基本面的发展。从好的方面来看,长期股东已经赚到了钱,过去五年的年回报率为14%。最近的抛售可能是一个机会,因此可能值得查看基本面数据,以寻找长期增长趋势的迹象。如果你想更详细地研究雷克斯诺,那么你可能想看看内部人士是否一直在买入或卖出该公司的股票。
当然了,如果你把目光投向别处,你可能会发现这是一笔很棒的投资。所以让我们来看看这个免费我们预计收益将会增长的公司名单。
请注意,本文引用的市场回报反映了目前在美国交易所交易的股票的市场加权平均回报。
对这篇文章有什么反馈吗?担心内容吗?保持联系直接与我们联系。或者,也可以给编辑组发电子邮件,地址是implywallst.com。
本文由Simply Wall St.撰写,具有概括性。我们仅使用不偏不倚的方法提供基于历史数据和分析师预测的评论,我们的文章并不打算作为财务建议。它不构成买卖任何股票的建议,也没有考虑你的目标或你的财务状况。我们的目标是为您带来由基本面数据驱动的长期重点分析。请注意,我们的分析可能不会将最新的对价格敏感的公司公告或定性材料考虑在内。Simply Wall St.对上述任何一只股票都没有持仓。
moomoo是Moomoo Technologies Inc.公司提供的金融信息和交易应用程序。
在美国,moomoo上的投资产品和服务由Moomoo Financial Inc.提供,一家受美国证券交易委员会(SEC)监管的持牌主体。 Moomoo Financial Inc.是金融业监管局(FINRA)和证券投资者保护公司(SIPC)的成员。
在新加坡,moomoo上的投资产品和服务是通过Moomoo Financial Singapore Pte. Ltd.提供,该公司受新加坡金融管理局(MAS)监管(牌照号码︰CMS101000) ,持有资本市场服务牌照 (CMS) ,持有财务顾问豁免(Exempt Financial Adviser)资质。本内容未经新加坡金融管理局的审查。
在澳大利亚,moomoo上的金融产品和服务是通过Futu Securities (Australia) Ltd提供,该公司是受澳大利亚证券和投资委员会(ASIC)监管的澳大利亚金融服务许可机构(AFSL No. 224663)。请阅读并理解我们的《金融服务指南》、《条款与条件》、《隐私政策》和其他披露文件,这些文件可在我们的网站 https://www.moomoo.com/au中获取。
在加拿大,通过moomoo应用提供的仅限订单执行的券商服务由Moomoo Financial Canada Inc.提供,并受加拿大投资监管机构(CIRO)监管。
在马来西亚,moomoo上的投资产品和服务是通过Moomoo Securities Malaysia Sdn. Bhd. 提供,该公司受马来西亚证券监督委员会(SC)监管(牌照号码︰eCMSL/A0397/2024) ,持有资本市场服务牌照 (CMSL) 。本内容未经马来西亚证券监督委员会的审查。
Moomoo Technologies Inc., Moomoo Financial Inc., Moomoo Financial Singapore Pte. Ltd., Futu Securities (Australia) Ltd, Moomoo Financial Canada Inc.,和Moomoo Securities Malaysia Sdn. Bhd.是关联公司。
风险及免责提示
moomoo是Moomoo Technologies Inc.公司提供的金融信息和交易应用程序。
在美国,moomoo上的投资产品和服务由Moomoo Financial Inc.提供,一家受美国证券交易委员会(SEC)监管的持牌主体。 Moomoo Financial Inc.是金融业监管局(FINRA)和证券投资者保护公司(SIPC)的成员。
在新加坡,moomoo上的投资产品和服务是通过Moomoo Financial Singapore Pte. Ltd.提供,该公司受新加坡金融管理局(MAS)监管(牌照号码︰CMS101000) ,持有资本市场服务牌照 (CMS) ,持有财务顾问豁免(Exempt Financial Adviser)资质。本内容未经新加坡金融管理局的审查。
在澳大利亚,moomoo上的金融产品和服务是通过Futu Securities (Australia) Ltd提供,该公司是受澳大利亚证券和投资委员会(ASIC)监管的澳大利亚金融服务许可机构(AFSL No. 224663)。请阅读并理解我们的《金融服务指南》、《条款与条件》、《隐私政策》和其他披露文件,这些文件可在我们的网站 https://www.moomoo.com/au中获取。
在加拿大,通过moomoo应用提供的仅限订单执行的券商服务由Moomoo Financial Canada Inc.提供,并受加拿大投资监管机构(CIRO)监管。
在马来西亚,moomoo上的投资产品和服务是通过Moomoo Securities Malaysia Sdn. Bhd. 提供,该公司受马来西亚证券监督委员会(SC)监管(牌照号码︰eCMSL/A0397/2024) ,持有资本市场服务牌照 (CMSL) 。本内容未经马来西亚证券监督委员会的审查。
Moomoo Technologies Inc., Moomoo Financial Inc., Moomoo Financial Singapore Pte. Ltd., Futu Securities (Australia) Ltd, Moomoo Financial Canada Inc.,和Moomoo Securities Malaysia Sdn. Bhd.是关联公司。
- 分享到weixin
- 分享到qq
- 分享到facebook
- 分享到twitter
- 分享到微博
- 粘贴板
使用浏览器的分享功能,分享给你的好友吧