
-
市场
-
产品
-
资讯
-
Moo社区
-
课堂
-
查看更多
-
功能介绍
-
费用费用透明,无最低余额限制
投资选择、功能介绍、费用相关信息由Moomoo Financial Inc.提供
- English
- 中文繁體
- 中文简体
- 深色
- 浅色
AAON's (NASDAQ:AAON) 16% CAGR Outpaced the Company's Earnings Growth Over the Same Five-year Period
AAON's (NASDAQ:AAON) 16% CAGR Outpaced the Company's Earnings Growth Over the Same Five-year Period
When you buy a stock there is always a possibility that it could drop 100%. But on a lighter note, a good company can see its share price rise well over 100%. For instance, the price of AAON, Inc. (NASDAQ:AAON) stock is up an impressive 106% over the last five years. Also pleasing for shareholders was the 42% gain in the last three months.
On the back of a solid 7-day performance, let's check what role the company's fundamentals have played in driving long term shareholder returns.
See our latest analysis for AAON
To quote Buffett, 'Ships will sail around the world but the Flat Earth Society will flourish. There will continue to be wide discrepancies between price and value in the marketplace...' One imperfect but simple way to consider how the market perception of a company has shifted is to compare the change in the earnings per share (EPS) with the share price movement.
Over half a decade, AAON managed to grow its earnings per share at 6.0% a year. This EPS growth is lower than the 16% average annual increase in the share price. So it's fair to assume the market has a higher opinion of the business than it did five years ago. And that's hardly shocking given the track record of growth. This favorable sentiment is reflected in its (fairly optimistic) P/E ratio of 60.34.
The image below shows how EPS has tracked over time (if you click on the image you can see greater detail).
It's probably worth noting that the CEO is paid less than the median at similar sized companies. But while CEO remuneration is always worth checking, the really important question is whether the company can grow earnings going forward. Before buying or selling a stock, we always recommend a close examination of historic growth trends, available here..
What About Dividends?
It is important to consider the total shareholder return, as well as the share price return, for any given stock. The TSR incorporates the value of any spin-offs or discounted capital raisings, along with any dividends, based on the assumption that the dividends are reinvested. It's fair to say that the TSR gives a more complete picture for stocks that pay a dividend. In the case of AAON, it has a TSR of 113% for the last 5 years. That exceeds its share price return that we previously mentioned. And there's no prize for guessing that the dividend payments largely explain the divergence!
A Different Perspective
We're pleased to report that AAON shareholders have received a total shareholder return of 8.1% over one year. Of course, that includes the dividend. Having said that, the five-year TSR of 16% a year, is even better. The pessimistic view would be that be that the stock has its best days behind it, but on the other hand the price might simply be moderating while the business itself continues to execute. I find it very interesting to look at share price over the long term as a proxy for business performance. But to truly gain insight, we need to consider other information, too. For instance, we've identified 2 warning signs for AAON (1 is concerning) that you should be aware of.
But note: AAON may not be the best stock to buy. So take a peek at this free list of interesting companies with past earnings growth (and further growth forecast).
Please note, the market returns quoted in this article reflect the market weighted average returns of stocks that currently trade on US exchanges.
Have feedback on this article? Concerned about the content? Get in touch with us directly. Alternatively, email editorial-team (at) simplywallst.com.
This article by Simply Wall St is general in nature. We provide commentary based on historical data and analyst forecasts only using an unbiased methodology and our articles are not intended to be financial advice. It does not constitute a recommendation to buy or sell any stock, and does not take account of your objectives, or your financial situation. We aim to bring you long-term focused analysis driven by fundamental data. Note that our analysis may not factor in the latest price-sensitive company announcements or qualitative material. Simply Wall St has no position in any stocks mentioned.
When you buy a stock there is always a possibility that it could drop 100%. But on a lighter note, a good company can see its share price rise well over 100%. For instance, the price of AAON, Inc. (NASDAQ:AAON) stock is up an impressive 106% over the last five years. Also pleasing for shareholders was the 42% gain in the last three months.
当你买入股票时,它总是有可能下跌100%。但简而言之,一家好公司的股价涨幅可以远远超过100%。例如,的价格 AAON, Inc. 纳斯达克股票代码:AAON)的股票在过去五年中上涨了令人印象深刻的106%。过去三个月中42%的涨幅也令股东感到高兴。
On the back of a solid 7-day performance, let's check what role the company's fundamentals have played in driving long term shareholder returns.
在连续7天表现稳健的背景下,让我们来看看公司的基本面在推动长期股东回报方面发挥了什么作用。
See our latest analysis for AAON
查看我们对 AAON 的最新分析
To quote Buffett, 'Ships will sail around the world but the Flat Earth Society will flourish. There will continue to be wide discrepancies between price and value in the marketplace...' One imperfect but simple way to consider how the market perception of a company has shifted is to compare the change in the earnings per share (EPS) with the share price movement.
引用巴菲特的话说:“船只将在世界各地航行,但Flat Earth Society将蓬勃发展。市场上的价格和价值之间将继续存在巨大差异...”考虑市场对公司的看法发生了怎样的变化的一种不完美但简单的方法是将每股收益(EPS)的变化与股价走势进行比较。
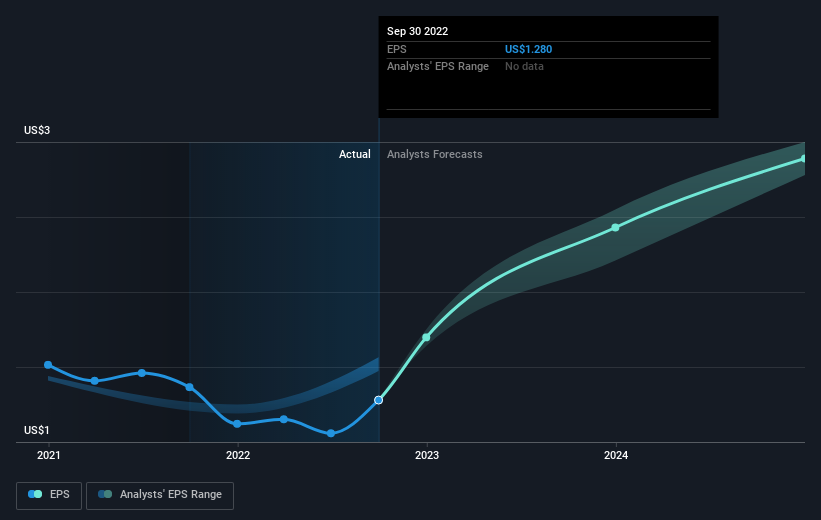
Over half a decade, AAON managed to grow its earnings per share at 6.0% a year. This EPS growth is lower than the 16% average annual increase in the share price. So it's fair to assume the market has a higher opinion of the business than it did five years ago. And that's hardly shocking given the track record of growth. This favorable sentiment is reflected in its (fairly optimistic) P/E ratio of 60.34.
在过去的五年中,AAON设法将其每股收益增长到每年6.0%。这种每股收益的增长低于股价每年平均增长16%。因此,可以公平地假设市场对这项业务的看法比五年前更高。考虑到增长记录,这并不令人震惊。这种乐观情绪反映在其(相当乐观的)市盈率60.34上。
The image below shows how EPS has tracked over time (if you click on the image you can see greater detail).
下图显示了 EPS 在一段时间内的跟踪情况(如果你点击图片,你可以看到更多细节)。
It's probably worth noting that the CEO is paid less than the median at similar sized companies. But while CEO remuneration is always worth checking, the really important question is whether the company can grow earnings going forward. Before buying or selling a stock, we always recommend a close examination of historic growth trends, available here..
可能值得注意的是,首席执行官的薪水低于类似规模公司的中位数。但是,尽管首席执行官的薪酬总是值得检查的,但真正重要的问题是公司未来能否增加收益。在买入或卖出股票之前,我们始终建议仔细研究历史增长趋势,可在此处查阅。
What About Dividends?
那股息呢?
It is important to consider the total shareholder return, as well as the share price return, for any given stock. The TSR incorporates the value of any spin-offs or discounted capital raisings, along with any dividends, based on the assumption that the dividends are reinvested. It's fair to say that the TSR gives a more complete picture for stocks that pay a dividend. In the case of AAON, it has a TSR of 113% for the last 5 years. That exceeds its share price return that we previously mentioned. And there's no prize for guessing that the dividend payments largely explain the divergence!
重要的是要考虑任何给定股票的股东总回报以及股价回报率。TSR纳入了任何分拆或折扣资本筹集的价值以及任何股息,前提是股息是再投资的。可以公平地说,TSR更全面地描述了支付股息的股票。就AAON而言,在过去五年中,其股东总回报率为113%。这超过了我们之前提到的股价回报率。而且,猜测股息支付在很大程度上解释了这种分歧是没有好处的!
A Different Perspective
不同的视角
We're pleased to report that AAON shareholders have received a total shareholder return of 8.1% over one year. Of course, that includes the dividend. Having said that, the five-year TSR of 16% a year, is even better. The pessimistic view would be that be that the stock has its best days behind it, but on the other hand the price might simply be moderating while the business itself continues to execute. I find it very interesting to look at share price over the long term as a proxy for business performance. But to truly gain insight, we need to consider other information, too. For instance, we've identified 2 warning signs for AAON (1 is concerning) that you should be aware of.
我们很高兴地向大家报告,AAON股东在一年内获得了8.1%的股东总回报。当然,这包括分红。话虽如此,每年16%的五年期股东总回报率甚至更好。悲观的观点是,该股已经过了最好的日子,但另一方面,在业务本身继续执行的同时,价格可能只是在放缓。我觉得从长远来看股价作为业务表现的代表非常有趣。但是,要真正获得见解,我们也需要考虑其他信息。例如,我们已经确定了 AAON 的 2 个警告标志 (1 是令人担忧的),你应该注意。
But note: AAON may not be the best stock to buy. So take a peek at this free list of interesting companies with past earnings growth (and further growth forecast).
但请注意: AAON 可能不是最值得买入的股票。所以来看看这个 免费的 过去盈利增长(以及进一步增长预测)的有趣公司名单。
Please note, the market returns quoted in this article reflect the market weighted average returns of stocks that currently trade on US exchanges.
请注意,本文引用的市场回报反映了目前在美国交易所交易的股票的市场加权平均回报。
Have feedback on this article? Concerned about the content? Get in touch with us directly. Alternatively, email editorial-team (at) simplywallst.com.
This article by Simply Wall St is general in nature. We provide commentary based on historical data and analyst forecasts only using an unbiased methodology and our articles are not intended to be financial advice. It does not constitute a recommendation to buy or sell any stock, and does not take account of your objectives, or your financial situation. We aim to bring you long-term focused analysis driven by fundamental data. Note that our analysis may not factor in the latest price-sensitive company announcements or qualitative material. Simply Wall St has no position in any stocks mentioned.
对这篇文章有反馈吗?对内容感到担忧? 取得联系 直接和我们联系。 或者,给编辑团队 (at) simplywallst.com 发送电子邮件。
Simply Wall St 的这篇文章本质上是一般性的。 我们仅使用不偏不倚的方法根据历史数据和分析师预测提供评论,我们的文章并非旨在提供财务建议。 它不构成买入或卖出任何股票的建议,也没有考虑您的目标或财务状况。我们的目标是为您提供由基本面数据驱动的长期重点分析。请注意,我们的分析可能未将最新的价格敏感型公司公告或定性材料考虑在内。简而言之,华尔街对上述任何股票都没有头寸。
moomoo是Moomoo Technologies Inc.公司提供的金融信息和交易应用程序。
在美国,moomoo上的投资产品和服务由Moomoo Financial Inc.提供,一家受美国证券交易委员会(SEC)监管的持牌主体。 Moomoo Financial Inc.是金融业监管局(FINRA)和证券投资者保护公司(SIPC)的成员。
在新加坡,moomoo上的投资产品和服务是通过Moomoo Financial Singapore Pte. Ltd.提供,该公司受新加坡金融管理局(MAS)监管(牌照号码︰CMS101000) ,持有资本市场服务牌照 (CMS) ,持有财务顾问豁免(Exempt Financial Adviser)资质。本内容未经新加坡金融管理局的审查。
在澳大利亚,moomoo上的金融产品和服务是通过Futu Securities (Australia) Ltd提供,该公司是受澳大利亚证券和投资委员会(ASIC)监管的澳大利亚金融服务许可机构(AFSL No. 224663)。请阅读并理解我们的《金融服务指南》、《条款与条件》、《隐私政策》和其他披露文件,这些文件可在我们的网站 https://www.moomoo.com/au中获取。
在加拿大,通过moomoo应用提供的仅限订单执行的券商服务由Moomoo Financial Canada Inc.提供,并受加拿大投资监管机构(CIRO)监管。
在马来西亚,moomoo上的投资产品和服务是通过Moomoo Securities Malaysia Sdn. Bhd. 提供,该公司受马来西亚证券监督委员会(SC)监管(牌照号码︰eCMSL/A0397/2024) ,持有资本市场服务牌照 (CMSL) 。本内容未经马来西亚证券监督委员会的审查。
Moomoo Technologies Inc., Moomoo Financial Inc., Moomoo Financial Singapore Pte. Ltd., Futu Securities (Australia) Ltd, Moomoo Financial Canada Inc.,和Moomoo Securities Malaysia Sdn. Bhd.是关联公司。
风险及免责提示
moomoo是Moomoo Technologies Inc.公司提供的金融信息和交易应用程序。
在美国,moomoo上的投资产品和服务由Moomoo Financial Inc.提供,一家受美国证券交易委员会(SEC)监管的持牌主体。 Moomoo Financial Inc.是金融业监管局(FINRA)和证券投资者保护公司(SIPC)的成员。
在新加坡,moomoo上的投资产品和服务是通过Moomoo Financial Singapore Pte. Ltd.提供,该公司受新加坡金融管理局(MAS)监管(牌照号码︰CMS101000) ,持有资本市场服务牌照 (CMS) ,持有财务顾问豁免(Exempt Financial Adviser)资质。本内容未经新加坡金融管理局的审查。
在澳大利亚,moomoo上的金融产品和服务是通过Futu Securities (Australia) Ltd提供,该公司是受澳大利亚证券和投资委员会(ASIC)监管的澳大利亚金融服务许可机构(AFSL No. 224663)。请阅读并理解我们的《金融服务指南》、《条款与条件》、《隐私政策》和其他披露文件,这些文件可在我们的网站 https://www.moomoo.com/au中获取。
在加拿大,通过moomoo应用提供的仅限订单执行的券商服务由Moomoo Financial Canada Inc.提供,并受加拿大投资监管机构(CIRO)监管。
在马来西亚,moomoo上的投资产品和服务是通过Moomoo Securities Malaysia Sdn. Bhd. 提供,该公司受马来西亚证券监督委员会(SC)监管(牌照号码︰eCMSL/A0397/2024) ,持有资本市场服务牌照 (CMSL) 。本内容未经马来西亚证券监督委员会的审查。
Moomoo Technologies Inc., Moomoo Financial Inc., Moomoo Financial Singapore Pte. Ltd., Futu Securities (Australia) Ltd, Moomoo Financial Canada Inc.,和Moomoo Securities Malaysia Sdn. Bhd.是关联公司。
- 分享到weixin
- 分享到qq
- 分享到facebook
- 分享到twitter
- 分享到微博
- 粘贴板
使用浏览器的分享功能,分享给你的好友吧