
-
市场
-
产品
-
资讯
-
Moo社区
-
课堂
-
查看更多
-
功能介绍
-
费用费用透明,无最低余额限制
投资选择、功能介绍、费用相关信息由Moomoo Financial Inc.提供
- English
- 中文繁體
- 中文简体
- 深色
- 浅色
Is There An Opportunity With Kanzhun Limited's (NASDAQ:BZ) 47% Undervaluation?
Is There An Opportunity With Kanzhun Limited's (NASDAQ:BZ) 47% Undervaluation?
Today we will run through one way of estimating the intrinsic value of Kanzhun Limited (NASDAQ:BZ) by taking the expected future cash flows and discounting them to today's value. We will use the Discounted Cash Flow (DCF) model on this occasion. There's really not all that much to it, even though it might appear quite complex.
We generally believe that a company's value is the present value of all of the cash it will generate in the future. However, a DCF is just one valuation metric among many, and it is not without flaws. Anyone interested in learning a bit more about intrinsic value should have a read of the Simply Wall St analysis model.
Check out our latest analysis for Kanzhun
The Calculation
We're using the 2-stage growth model, which simply means we take in account two stages of company's growth. In the initial period the company may have a higher growth rate and the second stage is usually assumed to have a stable growth rate. In the first stage we need to estimate the cash flows to the business over the next ten years. Where possible we use analyst estimates, but when these aren't available we extrapolate the previous free cash flow (FCF) from the last estimate or reported value. We assume companies with shrinking free cash flow will slow their rate of shrinkage, and that companies with growing free cash flow will see their growth rate slow, over this period. We do this to reflect that growth tends to slow more in the early years than it does in later years.
A DCF is all about the idea that a dollar in the future is less valuable than a dollar today, and so the sum of these future cash flows is then discounted to today's value:
10-year free cash flow (FCF) forecast
| 2023 | 2024 | 2025 | 2026 | 2027 | 2028 | 2029 | 2030 | 2031 | 2032 | |
| Levered FCF (CN¥, Millions) | CN¥3.27b | CN¥4.63b | CN¥5.68b | CN¥6.61b | CN¥7.41b | CN¥8.09b | CN¥8.65b | CN¥9.12b | CN¥9.52b | CN¥9.87b |
| Growth Rate Estimate Source | Analyst x3 | Analyst x3 | Est @ 22.65% | Est @ 16.45% | Est @ 12.11% | Est @ 9.07% | Est @ 6.94% | Est @ 5.45% | Est @ 4.41% | Est @ 3.68% |
| Present Value (CN¥, Millions) Discounted @ 8.6% | CN¥3.0k | CN¥3.9k | CN¥4.4k | CN¥4.7k | CN¥4.9k | CN¥4.9k | CN¥4.8k | CN¥4.7k | CN¥4.5k | CN¥4.3k |
("Est" = FCF growth rate estimated by Simply Wall St)
Present Value of 10-year Cash Flow (PVCF) = CN¥44b
After calculating the present value of future cash flows in the initial 10-year period, we need to calculate the Terminal Value, which accounts for all future cash flows beyond the first stage. For a number of reasons a very conservative growth rate is used that cannot exceed that of a country's GDP growth. In this case we have used the 5-year average of the 10-year government bond yield (2.0%) to estimate future growth. In the same way as with the 10-year 'growth' period, we discount future cash flows to today's value, using a cost of equity of 8.6%.
Terminal Value (TV)= FCF2032 × (1 + g) ÷ (r – g) = CN¥9.9b× (1 + 2.0%) ÷ (8.6%– 2.0%) = CN¥151b
Present Value of Terminal Value (PVTV)= TV / (1 + r)10= CN¥151b÷ ( 1 + 8.6%)10= CN¥66b
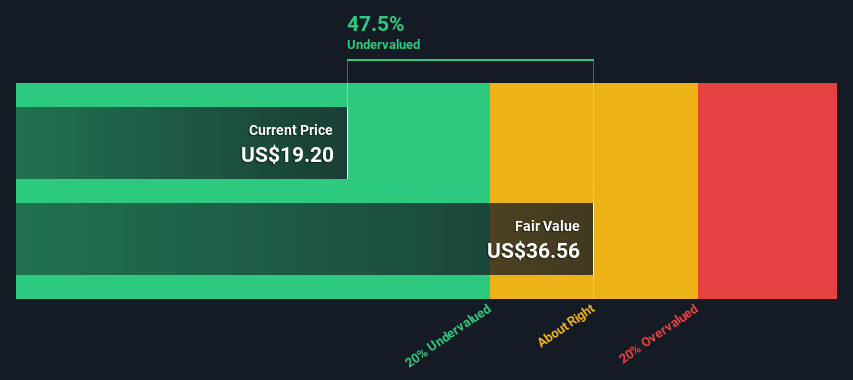
The total value, or equity value, is then the sum of the present value of the future cash flows, which in this case is CN¥110b. The last step is to then divide the equity value by the number of shares outstanding. Relative to the current share price of US$19.2, the company appears quite undervalued at a 47% discount to where the stock price trades currently. The assumptions in any calculation have a big impact on the valuation, so it is better to view this as a rough estimate, not precise down to the last cent.
 NasdaqGS:BZ Discounted Cash Flow December 25th 2022
The Assumptions
We would point out that the most important inputs to a discounted cash flow are the discount rate and of course the actual cash flows. If you don't agree with these result, have a go at the calculation yourself and play with the assumptions. The DCF also does not consider the possible cyclicality of an industry, or a company's future capital requirements, so it does not give a full picture of a company's potential performance. Given that we are looking at Kanzhun as potential shareholders, the cost of equity is used as the discount rate, rather than the cost of capital (or weighted average cost of capital, WACC) which accounts for debt. In this calculation we've used 8.6%, which is based on a levered beta of 1.028. Beta is a measure of a stock's volatility, compared to the market as a whole. We get our beta from the industry average beta of globally comparable companies, with an imposed limit between 0.8 and 2.0, which is a reasonable range for a stable business.
SWOT Analysis for Kanzhun
- Currently debt free.
- Balance sheet summary for BZ.
- Shareholders have been diluted in the past year.
- See BZ's current ownership breakdown.
- Annual earnings are forecast to grow faster than the American market.
- Trading below our estimate of fair value by more than 20%.
- No apparent threats visible for BZ.
Next Steps:
Valuation is only one side of the coin in terms of building your investment thesis, and it is only one of many factors that you need to assess for a company. DCF models are not the be-all and end-all of investment valuation. Preferably you'd apply different cases and assumptions and see how they would impact the company's valuation. If a company grows at a different rate, or if its cost of equity or risk free rate changes sharply, the output can look very different. Why is the intrinsic value higher than the current share price? For Kanzhun, we've compiled three important factors you should consider:
- Risks: Consider for instance, the ever-present spectre of investment risk. We've identified 3 warning signs with Kanzhun , and understanding these should be part of your investment process.
- Future Earnings: How does BZ's growth rate compare to its peers and the wider market? Dig deeper into the analyst consensus number for the upcoming years by interacting with our free analyst growth expectation chart.
- Other High Quality Alternatives: Do you like a good all-rounder? Explore our interactive list of high quality stocks to get an idea of what else is out there you may be missing!
PS. The Simply Wall St app conducts a discounted cash flow valuation for every stock on the NASDAQGS every day. If you want to find the calculation for other stocks just search here.
Have feedback on this article? Concerned about the content? Get in touch with us directly. Alternatively, email editorial-team (at) simplywallst.com.
This article by Simply Wall St is general in nature. We provide commentary based on historical data and analyst forecasts only using an unbiased methodology and our articles are not intended to be financial advice. It does not constitute a recommendation to buy or sell any stock, and does not take account of your objectives, or your financial situation. We aim to bring you long-term focused analysis driven by fundamental data. Note that our analysis may not factor in the latest price-sensitive company announcements or qualitative material. Simply Wall St has no position in any stocks mentioned.
今天,我们将使用一种方法来估计BOSS直聘(纳斯达克代码:BZ)的内在价值,方法是将预期的未来现金流折现为今天的价值。在这种情况下,我们将使用贴现现金流(DCF)模型。它真的没有那么多东西,尽管它可能看起来相当复杂。
我们通常认为,一家公司的价值是它未来将产生的所有现金的现值。然而,贴现现金流只是众多估值指标中的一个,它也并非没有缺陷。任何有兴趣了解更多内在价值的人,都应该阅读一下Simply Wall St.的分析模型。
看看我们对看准的最新分析
计算
我们使用的是两阶段增长模型,也就是说,我们考虑了公司发展的两个阶段。在初期,公司可能有较高的增长率,而第二阶段通常被假设为有一个稳定的增长率。在第一阶段,我们需要估计未来十年为企业带来的现金流。在可能的情况下,我们使用分析师的估计,但当这些估计不可用时,我们会根据上次估计或报告的价值推断先前的自由现金流(FCF)。我们假设,自由现金流萎缩的公司将减缓收缩速度,而自由现金流增长的公司在这段时间内的增长速度将放缓。我们这样做是为了反映出,增长在最初几年往往比后来几年放缓得更多。
贴现现金流就是这样一种想法,即未来的一美元不如现在的一美元有价值,因此这些未来现金流的总和就会贴现到今天的价值:
10年自由现金流(FCF)预测
| 2023 | 2024 | 2025 | 2026 | 2027 | 2028 | 2029 | 2030 | 2031 | 2032 | |
| 杠杆FCF(CN元,百万元) | CN元32.7亿元 | 净额46.3亿元 | CN元56.8亿元 | CN元66.1亿元 | 净额74.1亿元 | CN元80.9亿元 | CN元86.5亿元 | CN元91.2亿元 | CN元95.2亿元 | 净额98.7亿元 |
| 增长率预估来源 | 分析师x3 | 分析师x3 | Est@22.65% | Est@16.45% | Est@12.11% | Est@9.07% | Est@6.94% | Est@5.45% | Est@4.41% | Est@3.68% |
| 现值(CN元,百万)贴现8.6% | CN元3.0K | CN元3.9万元 | CN元4.4K | CN元4.7K | CN元4.9K | CN元4.9K | CN元4.8K | CN元4.7K | CN元4.5K | CN元4.3K |
(“EST”=Simply Wall St.预估的FCF成长率)
10年期现金流现值(PVCF)=CN元440亿元
在计算了最初10年内未来现金流的现值后,我们需要计算终止值,它考虑了第一阶段之后的所有未来现金流。出于一些原因,使用了一个非常保守的增长率,不能超过一个国家的国内生产总值增长率。在这种情况下,我们使用了10年期政府债券收益率的5年平均值(2.0%)来估计未来的增长。与10年“增长”期一样,我们使用8.6%的权益成本,将未来现金流贴现到今天的价值。
终端值(TV)=FCF2032×(1+g)?(r-g)=CN元9.9b×(1+2.0%)?(8.6%-2.0%)=CN元151b
终值现值(PVTV)=TV/(1+r)10=CN元151B?(1+8.6%)10=CN元660亿元
那么,总价值或权益价值就是未来现金流的现值之和,在这种情况下,未来现金流的现值为110b元。最后一步是将股权价值除以流通股数量。相对于目前19.2美元的股价,该公司的估值似乎比目前的股价有47%的折让。任何计算中的假设都会对估值产生很大影响,因此最好将其视为粗略估计,而不是精确到最后一分钱。
NasdaqGS:BZ贴现现金流2022年12月25日假设
我们要指出,贴现现金流最重要的投入是贴现率,当然还有实际现金流。如果你不同意这些结果,你可以自己试一试计算,并玩弄一下假设。DCF也没有考虑一个行业可能的周期性,也没有考虑一家公司未来的资本要求,因此它没有给出一家公司潜在业绩的全貌。鉴于我们将看准视为潜在股东,我们使用股权成本作为贴现率,而不是考虑债务的资本成本(或加权平均资本成本,WACC)。在这个计算中,我们使用了8.6%,这是基于杠杆率为1.028的测试值。贝塔系数是衡量一只股票相对于整个市场的波动性的指标。我们的贝塔系数来自全球可比公司的行业平均贝塔系数,强制限制在0.8到2.0之间,这是一个稳定业务的合理范围。
看准的SWOT分析
- 目前没有债务。
- BZ的资产负债表摘要。
- 在过去的一年里,股东被稀释了。
- 参见BZ目前的所有权明细。
- 预计该公司的年收入增长速度将快于美国市场。
- 交易价格比我们估计的公允价值低20%以上。
- 对于BZ来说,没有明显的威胁。
接下来的步骤:
就构建你的投资论点而言,估值只是硬币的一面,它只是你需要为一家公司评估的众多因素之一。贴现现金流模型并不是投资估值的全部。你最好应用不同的案例和假设,看看它们会如何影响公司的估值。如果一家公司以不同的速度增长,或者如果其股本成本或无风险利率大幅变化,产出可能看起来非常不同。为什么内在价值高于当前股价?对于看准,我们整理了三个你应该考虑的重要因素:
- 风险例如,考虑一下一直存在的投资风险幽灵。我们已经确定了三个警告信号与看准的合作,了解这些应该是你投资过程的一部分。
- 未来收益:BZ的增长率与同行和更广泛的市场相比如何?通过与我们的免费分析师增长预期图表互动,更深入地挖掘分析师对未来几年的共识数字。
- 其他高质量替代产品:你喜欢一个好的全能运动员吗?浏览我们的高质量股票互动列表,了解您可能会错过的其他股票!
PS.Simply Wall St.应用程序每天对纳斯达克指数的每一只股票进行现金流贴现估值。如果你想找到其他股票的计算方法,只需搜索此处。
对这篇文章有什么反馈吗?担心内容吗? 保持联系直接与我们联系。或者,也可以给编辑组发电子邮件,地址是implywallst.com。
本文由Simply Wall St.撰写,具有概括性。我们仅使用不偏不倚的方法提供基于历史数据和分析师预测的评论,我们的文章并不打算作为财务建议。它不构成买卖任何股票的建议,也没有考虑你的目标或你的财务状况。我们的目标是为您带来由基本面数据驱动的长期重点分析。请注意,我们的分析可能不会将最新的对价格敏感的公司公告或定性材料考虑在内。Simply Wall St.对上述任何一只股票都没有持仓。
moomoo是Moomoo Technologies Inc.公司提供的金融信息和交易应用程序。
在美国,moomoo上的投资产品和服务由Moomoo Financial Inc.提供,一家受美国证券交易委员会(SEC)监管的持牌主体。 Moomoo Financial Inc.是金融业监管局(FINRA)和证券投资者保护公司(SIPC)的成员。
在新加坡,moomoo上的投资产品和服务是通过Moomoo Financial Singapore Pte. Ltd.提供,该公司受新加坡金融管理局(MAS)监管(牌照号码︰CMS101000) ,持有资本市场服务牌照 (CMS) ,持有财务顾问豁免(Exempt Financial Adviser)资质。本内容未经新加坡金融管理局的审查。
在澳大利亚,moomoo上的金融产品和服务是通过Futu Securities (Australia) Ltd提供,该公司是受澳大利亚证券和投资委员会(ASIC)监管的澳大利亚金融服务许可机构(AFSL No. 224663)。请阅读并理解我们的《金融服务指南》、《条款与条件》、《隐私政策》和其他披露文件,这些文件可在我们的网站 https://www.moomoo.com/au中获取。
在加拿大,通过moomoo应用提供的仅限订单执行的券商服务由Moomoo Financial Canada Inc.提供,并受加拿大投资监管机构(CIRO)监管。
在马来西亚,moomoo上的投资产品和服务是通过Moomoo Securities Malaysia Sdn. Bhd. 提供,该公司受马来西亚证券监督委员会(SC)监管(牌照号码︰eCMSL/A0397/2024) ,持有资本市场服务牌照 (CMSL) 。本内容未经马来西亚证券监督委员会的审查。
Moomoo Technologies Inc., Moomoo Financial Inc., Moomoo Financial Singapore Pte. Ltd., Futu Securities (Australia) Ltd, Moomoo Financial Canada Inc.,和Moomoo Securities Malaysia Sdn. Bhd.是关联公司。
风险及免责提示
moomoo是Moomoo Technologies Inc.公司提供的金融信息和交易应用程序。
在美国,moomoo上的投资产品和服务由Moomoo Financial Inc.提供,一家受美国证券交易委员会(SEC)监管的持牌主体。 Moomoo Financial Inc.是金融业监管局(FINRA)和证券投资者保护公司(SIPC)的成员。
在新加坡,moomoo上的投资产品和服务是通过Moomoo Financial Singapore Pte. Ltd.提供,该公司受新加坡金融管理局(MAS)监管(牌照号码︰CMS101000) ,持有资本市场服务牌照 (CMS) ,持有财务顾问豁免(Exempt Financial Adviser)资质。本内容未经新加坡金融管理局的审查。
在澳大利亚,moomoo上的金融产品和服务是通过Futu Securities (Australia) Ltd提供,该公司是受澳大利亚证券和投资委员会(ASIC)监管的澳大利亚金融服务许可机构(AFSL No. 224663)。请阅读并理解我们的《金融服务指南》、《条款与条件》、《隐私政策》和其他披露文件,这些文件可在我们的网站 https://www.moomoo.com/au中获取。
在加拿大,通过moomoo应用提供的仅限订单执行的券商服务由Moomoo Financial Canada Inc.提供,并受加拿大投资监管机构(CIRO)监管。
在马来西亚,moomoo上的投资产品和服务是通过Moomoo Securities Malaysia Sdn. Bhd. 提供,该公司受马来西亚证券监督委员会(SC)监管(牌照号码︰eCMSL/A0397/2024) ,持有资本市场服务牌照 (CMSL) 。本内容未经马来西亚证券监督委员会的审查。
Moomoo Technologies Inc., Moomoo Financial Inc., Moomoo Financial Singapore Pte. Ltd., Futu Securities (Australia) Ltd, Moomoo Financial Canada Inc.,和Moomoo Securities Malaysia Sdn. Bhd.是关联公司。
- 分享到weixin
- 分享到qq
- 分享到facebook
- 分享到twitter
- 分享到微博
- 粘贴板
使用浏览器的分享功能,分享给你的好友吧