
-
市场
-
产品
-
资讯
-
Moo社区
-
课堂
-
查看更多
-
功能介绍
-
费用费用透明,无最低余额限制
投资选择、功能介绍、费用相关信息由Moomoo Financial Inc.提供
- English
- 中文繁體
- 中文简体
- 深色
- 浅色
Dexin China Holdings (HKG:2019) Sheds CN¥432m, Company Earnings and Investor Returns Have Been Trending Downwards for Past Three Years
Dexin China Holdings (HKG:2019) Sheds CN¥432m, Company Earnings and Investor Returns Have Been Trending Downwards for Past Three Years
For many investors, the main point of stock picking is to generate higher returns than the overall market. But in any portfolio, there are likely to be some stocks that fall short of that benchmark. We regret to report that long term Dexin China Holdings Company Limited (HKG:2019) shareholders have had that experience, with the share price dropping 44% in three years, versus a market decline of about 2.4%. And the ride hasn't got any smoother in recent times over the last year, with the price 36% lower in that time. The falls have accelerated recently, with the share price down 36% in the last three months. This could be related to the recent financial results - you can catch up on the most recent data by reading our company report.
Since Dexin China Holdings has shed CN¥432m from its value in the past 7 days, let's see if the longer term decline has been driven by the business' economics.
See our latest analysis for Dexin China Holdings
While the efficient markets hypothesis continues to be taught by some, it has been proven that markets are over-reactive dynamic systems, and investors are not always rational. One imperfect but simple way to consider how the market perception of a company has shifted is to compare the change in the earnings per share (EPS) with the share price movement.
During the three years that the share price fell, Dexin China Holdings' earnings per share (EPS) dropped by 24% each year. In comparison the 17% compound annual share price decline isn't as bad as the EPS drop-off. So the market may not be too worried about the EPS figure, at the moment -- or it may have previously priced some of the drop in.
The company's earnings per share (over time) is depicted in the image below (click to see the exact numbers).
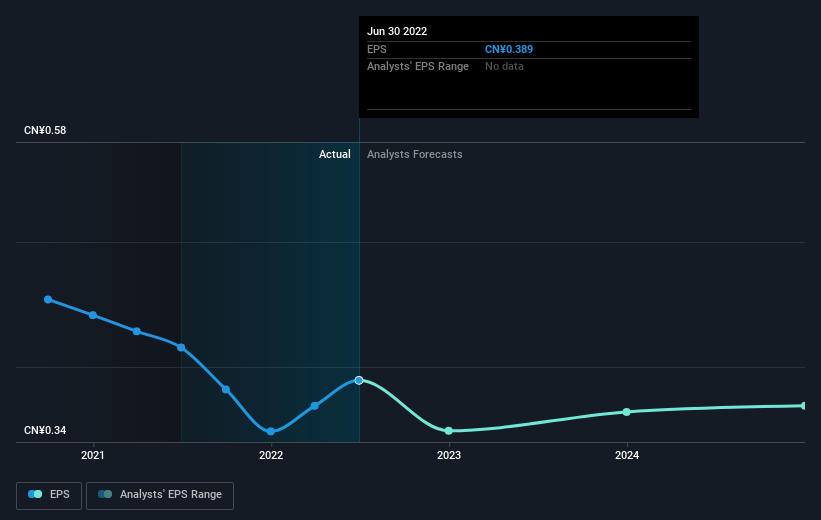 SEHK:2019 Earnings Per Share Growth September 21st 2022
It might be well worthwhile taking a look at our free report on Dexin China Holdings' earnings, revenue and cash flow.
What About Dividends?
As well as measuring the share price return, investors should also consider the total shareholder return (TSR). The TSR is a return calculation that accounts for the value of cash dividends (assuming that any dividend received was reinvested) and the calculated value of any discounted capital raisings and spin-offs. Arguably, the TSR gives a more comprehensive picture of the return generated by a stock. We note that for Dexin China Holdings the TSR over the last 3 years was -35%, which is better than the share price return mentioned above. This is largely a result of its dividend payments!
A Different Perspective
The last twelve months weren't great for Dexin China Holdings shares, which performed worse than the market, costing holders 33%, including dividends. Meanwhile, the broader market slid about 19%, likely weighing on the stock. Shareholders have lost 10% per year over the last three years, so the share price drop has become steeper, over the last year; a potential symptom of as yet unsolved challenges. We would be wary of buying into a company with unsolved problems, although some investors will buy into struggling stocks if they believe the price is sufficiently attractive. It's always interesting to track share price performance over the longer term. But to understand Dexin China Holdings better, we need to consider many other factors. Consider for instance, the ever-present spectre of investment risk. We've identified 3 warning signs with Dexin China Holdings (at least 1 which doesn't sit too well with us) , and understanding them should be part of your investment process.
We will like Dexin China Holdings better if we see some big insider buys. While we wait, check out this free list of growing companies with considerable, recent, insider buying.
Please note, the market returns quoted in this article reflect the market weighted average returns of stocks that currently trade on HK exchanges.
Have feedback on this article? Concerned about the content? Get in touch with us directly. Alternatively, email editorial-team (at) simplywallst.com.
This article by Simply Wall St is general in nature. We provide commentary based on historical data and analyst forecasts only using an unbiased methodology and our articles are not intended to be financial advice. It does not constitute a recommendation to buy or sell any stock, and does not take account of your objectives, or your financial situation. We aim to bring you long-term focused analysis driven by fundamental data. Note that our analysis may not factor in the latest price-sensitive company announcements or qualitative material. Simply Wall St has no position in any stocks mentioned.
对于许多投资者来说,选股的主要着眼点是产生高于整体市场的回报。但在任何投资组合中,都可能会有一些股票没有达到这一基准。我们很遗憾地报告这一长期的德信中国控股有限公司(HKG:2019)股东有过这样的经历,股价在三年内下跌了44%,而市场跌幅约为2.4%。在过去的一年里,这一过程并没有变得更顺利,价格在这段时间里下降了36%。股价最近加速下跌,在过去三个月里下跌了36%。这可能与最近的财务业绩有关-您可以通过阅读我们的公司报告来了解最新的数据。
由于德信中国控股在过去7天里市值缩水4.32亿元人民币,让我们看看长期下跌是否受到了企业经济的推动。
查看我们对德信中国控股的最新分析
虽然有效市场假说继续被一些人传授,但事实证明,市场是过度反应的动态系统,投资者并不总是理性的。一种不完美但简单的方法来考虑市场对一家公司的看法是如何改变的,那就是将每股收益(EPS)的变化与股价走势进行比较。
在股价下跌的三年里,德信中国控股的每股收益(EPS)每年下降24%。相比之下,17%的年复合股价跌幅没有每股收益下跌那么严重。因此,目前市场可能并不太担心每股收益的数字--或者它之前可能已经计入了部分降幅。
该公司的每股收益(在一段时间内)如下图所示(点击查看具体数字)。
联交所:2019年9月21日每股收益增长也许很值得一看我们的免费德信中国控股的收益、收入和现金流报告。
那股息呢?
除了衡量股价回报外,投资者还应考虑总股东回报(TSR)。TSR是一种回报计算,计入了现金股息的价值(假设收到的任何股息都进行了再投资),以及任何贴现融资和剥离的计算价值。可以说,TSR更全面地描绘了一只股票产生的回报。我们注意到,德信中国控股过去3年的总回报率为-35%,好于上面提到的股价回报率。这在很大程度上是其股息支付的结果!
不同的视角
过去12个月对德信中国控股的股票来说并不好,该股的表现逊于大盘,持股者损失了33%,其中包括股息。与此同时,大盘下跌约19%,可能令该股承压。股东在过去三年里每年损失10%,因此股价在过去一年里跌幅变得更大;这是尚未解决的挑战的潜在症状。我们会对买入一家问题尚未解决的公司持谨慎态度,尽管一些投资者如果认为价格足够有吸引力,就会买入陷入困境的股票。跟踪股价的长期表现总是很有趣的。但要更好地了解德信中国控股,我们还需要考虑许多其他因素。例如,考虑一下无处不在的投资风险幽灵。我们已经确定了三个警告信号与德信中国控股(至少1家,我们不太满意),了解他们应该是你投资过程的一部分。
如果我们看到一些大的内部收购,我们会更喜欢德信中国控股。在我们等待的时候,看看这个免费最近有大量内幕收购的成长型公司名单。
请注意,本文引用的市场回报反映了目前在香港交易所交易的股票的市场加权平均回报。
对这篇文章有什么反馈吗?担心内容吗? 保持联系直接与我们联系。或者,也可以给编辑组发电子邮件,地址是implywallst.com。
本文由Simply Wall St.撰写,具有概括性。我们仅使用不偏不倚的方法提供基于历史数据和分析师预测的评论,我们的文章并不打算作为财务建议。它不构成买卖任何股票的建议,也没有考虑你的目标或你的财务状况。我们的目标是为您带来由基本面数据驱动的长期重点分析。请注意,我们的分析可能不会将最新的对价格敏感的公司公告或定性材料考虑在内。Simply Wall St.对上述任何一只股票都没有持仓。
moomoo是Moomoo Technologies Inc.公司提供的金融信息和交易应用程序。
在美国,moomoo上的投资产品和服务由Moomoo Financial Inc.提供,一家受美国证券交易委员会(SEC)监管的持牌主体。 Moomoo Financial Inc.是金融业监管局(FINRA)和证券投资者保护公司(SIPC)的成员。
在新加坡,moomoo上的投资产品和服务是通过Moomoo Financial Singapore Pte. Ltd.提供,该公司受新加坡金融管理局(MAS)监管(牌照号码︰CMS101000) ,持有资本市场服务牌照 (CMS) ,持有财务顾问豁免(Exempt Financial Adviser)资质。本内容未经新加坡金融管理局的审查。
在澳大利亚,moomoo上的金融产品和服务是通过Futu Securities (Australia) Ltd提供,该公司是受澳大利亚证券和投资委员会(ASIC)监管的澳大利亚金融服务许可机构(AFSL No. 224663)。请阅读并理解我们的《金融服务指南》、《条款与条件》、《隐私政策》和其他披露文件,这些文件可在我们的网站 https://www.moomoo.com/au中获取。
在加拿大,通过moomoo应用提供的仅限订单执行的券商服务由Moomoo Financial Canada Inc.提供,并受加拿大投资监管机构(CIRO)监管。
在马来西亚,moomoo上的投资产品和服务是通过Moomoo Securities Malaysia Sdn. Bhd. 提供,该公司受马来西亚证券监督委员会(SC)监管(牌照号码︰eCMSL/A0397/2024) ,持有资本市场服务牌照 (CMSL) 。本内容未经马来西亚证券监督委员会的审查。
Moomoo Technologies Inc., Moomoo Financial Inc., Moomoo Financial Singapore Pte. Ltd., Futu Securities (Australia) Ltd, Moomoo Financial Canada Inc.,和Moomoo Securities Malaysia Sdn. Bhd.是关联公司。
风险及免责提示
moomoo是Moomoo Technologies Inc.公司提供的金融信息和交易应用程序。
在美国,moomoo上的投资产品和服务由Moomoo Financial Inc.提供,一家受美国证券交易委员会(SEC)监管的持牌主体。 Moomoo Financial Inc.是金融业监管局(FINRA)和证券投资者保护公司(SIPC)的成员。
在新加坡,moomoo上的投资产品和服务是通过Moomoo Financial Singapore Pte. Ltd.提供,该公司受新加坡金融管理局(MAS)监管(牌照号码︰CMS101000) ,持有资本市场服务牌照 (CMS) ,持有财务顾问豁免(Exempt Financial Adviser)资质。本内容未经新加坡金融管理局的审查。
在澳大利亚,moomoo上的金融产品和服务是通过Futu Securities (Australia) Ltd提供,该公司是受澳大利亚证券和投资委员会(ASIC)监管的澳大利亚金融服务许可机构(AFSL No. 224663)。请阅读并理解我们的《金融服务指南》、《条款与条件》、《隐私政策》和其他披露文件,这些文件可在我们的网站 https://www.moomoo.com/au中获取。
在加拿大,通过moomoo应用提供的仅限订单执行的券商服务由Moomoo Financial Canada Inc.提供,并受加拿大投资监管机构(CIRO)监管。
在马来西亚,moomoo上的投资产品和服务是通过Moomoo Securities Malaysia Sdn. Bhd. 提供,该公司受马来西亚证券监督委员会(SC)监管(牌照号码︰eCMSL/A0397/2024) ,持有资本市场服务牌照 (CMSL) 。本内容未经马来西亚证券监督委员会的审查。
Moomoo Technologies Inc., Moomoo Financial Inc., Moomoo Financial Singapore Pte. Ltd., Futu Securities (Australia) Ltd, Moomoo Financial Canada Inc.,和Moomoo Securities Malaysia Sdn. Bhd.是关联公司。
- 分享到weixin
- 分享到qq
- 分享到facebook
- 分享到twitter
- 分享到微博
- 粘贴板
使用浏览器的分享功能,分享给你的好友吧